Asian vs Scotch-Irish 7th Grade
COMPARE
Asian
Scotch-Irish
7th Grade
7th Grade Comparison
Asians
Scotch-Irish
95.5%
7TH GRADE
2.6/ 100
METRIC RATING
236th/ 347
METRIC RANK
97.4%
7TH GRADE
100.0/ 100
METRIC RATING
26th/ 347
METRIC RANK
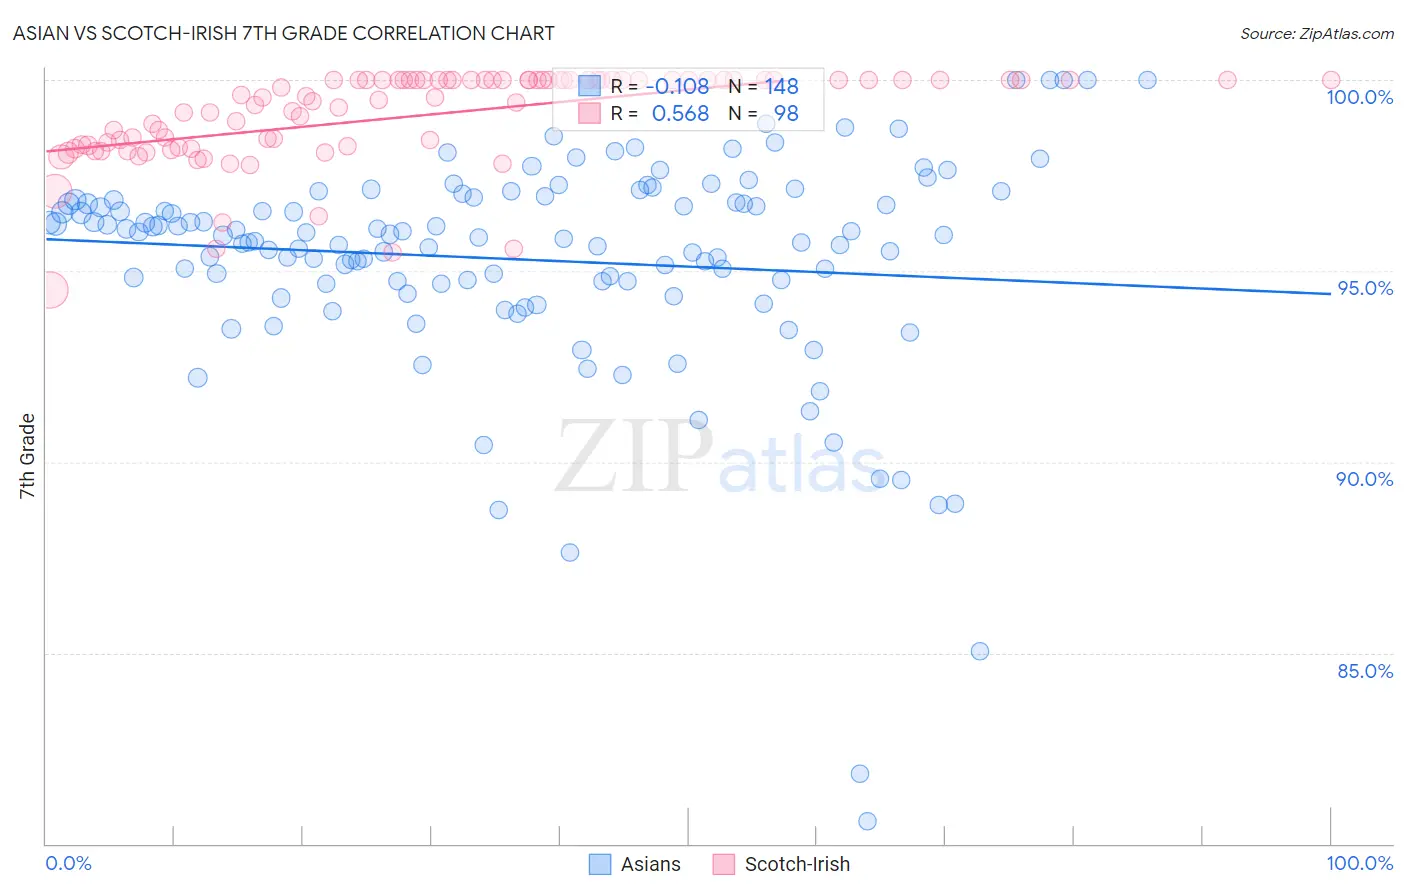
Asian vs Scotch-Irish 7th Grade Correlation Chart
The statistical analysis conducted on geographies consisting of 550,917,032 people shows a poor negative correlation between the proportion of Asians and percentage of population with at least 7th grade education in the United States with a correlation coefficient (R) of -0.108 and weighted average of 95.5%. Similarly, the statistical analysis conducted on geographies consisting of 548,777,407 people shows a substantial positive correlation between the proportion of Scotch-Irish and percentage of population with at least 7th grade education in the United States with a correlation coefficient (R) of 0.568 and weighted average of 97.4%, a difference of 2.0%.
7th Grade Correlation Summary
| Measurement | Asian | Scotch-Irish |
| Minimum | 80.6% | 94.5% |
| Maximum | 100.0% | 100.0% |
| Range | 19.4% | 5.5% |
| Mean | 95.3% | 99.1% |
| Median | 95.9% | 99.6% |
| Interquartile 25% (IQ1) | 94.7% | 98.3% |
| Interquartile 75% (IQ3) | 96.9% | 100.0% |
| Interquartile Range (IQR) | 2.2% | 1.7% |
| Standard Deviation (Sample) | 2.9% | 1.2% |
| Standard Deviation (Population) | 2.9% | 1.2% |
Similar Demographics by 7th Grade
Demographics Similar to Asians by 7th Grade
In terms of 7th grade, the demographic groups most similar to Asians are Immigrants from Africa (95.5%, a difference of 0.010%), Immigrants from Asia (95.5%, a difference of 0.010%), Nigerian (95.5%, a difference of 0.020%), Indian (Asian) (95.5%, a difference of 0.020%), and Jamaican (95.5%, a difference of 0.030%).
| Demographics | Rating | Rank | 7th Grade |
| Immigrants | Panama | 4.9 /100 | #229 | Tragic 95.6% |
| Natives/Alaskans | 4.2 /100 | #230 | Tragic 95.6% |
| Senegalese | 4.0 /100 | #231 | Tragic 95.6% |
| Costa Ricans | 3.3 /100 | #232 | Tragic 95.5% |
| Immigrants | Indonesia | 3.3 /100 | #233 | Tragic 95.5% |
| Nigerians | 3.0 /100 | #234 | Tragic 95.5% |
| Immigrants | Africa | 2.7 /100 | #235 | Tragic 95.5% |
| Asians | 2.6 /100 | #236 | Tragic 95.5% |
| Immigrants | Asia | 2.3 /100 | #237 | Tragic 95.5% |
| Indians (Asian) | 2.3 /100 | #238 | Tragic 95.5% |
| Jamaicans | 2.2 /100 | #239 | Tragic 95.5% |
| Immigrants | Sierra Leone | 2.0 /100 | #240 | Tragic 95.5% |
| South American Indians | 2.0 /100 | #241 | Tragic 95.5% |
| Immigrants | Senegal | 1.9 /100 | #242 | Tragic 95.5% |
| U.S. Virgin Islanders | 1.6 /100 | #243 | Tragic 95.4% |
Demographics Similar to Scotch-Irish by 7th Grade
In terms of 7th grade, the demographic groups most similar to Scotch-Irish are Danish (97.4%, a difference of 0.0%), Welsh (97.4%, a difference of 0.010%), French (97.4%, a difference of 0.010%), Croatian (97.4%, a difference of 0.020%), and Sioux (97.4%, a difference of 0.020%).
| Demographics | Rating | Rank | 7th Grade |
| Lithuanians | 100.0 /100 | #19 | Exceptional 97.5% |
| Yup'ik | 100.0 /100 | #20 | Exceptional 97.4% |
| Inupiat | 100.0 /100 | #21 | Exceptional 97.4% |
| French Canadians | 100.0 /100 | #22 | Exceptional 97.4% |
| Croatians | 100.0 /100 | #23 | Exceptional 97.4% |
| Welsh | 100.0 /100 | #24 | Exceptional 97.4% |
| French | 100.0 /100 | #25 | Exceptional 97.4% |
| Scotch-Irish | 100.0 /100 | #26 | Exceptional 97.4% |
| Danes | 100.0 /100 | #27 | Exceptional 97.4% |
| Sioux | 100.0 /100 | #28 | Exceptional 97.4% |
| Scandinavians | 100.0 /100 | #29 | Exceptional 97.4% |
| Czechs | 100.0 /100 | #30 | Exceptional 97.4% |
| Europeans | 100.0 /100 | #31 | Exceptional 97.3% |
| Italians | 100.0 /100 | #32 | Exceptional 97.3% |
| Chippewa | 100.0 /100 | #33 | Exceptional 97.3% |