Immigrants from Israel vs Immigrants from El Salvador Associate's Degree
COMPARE
Immigrants from Israel
Immigrants from El Salvador
Associate's Degree
Associate's Degree Comparison
Immigrants from Israel
Immigrants from El Salvador
56.8%
ASSOCIATE'S DEGREE
100.0/ 100
METRIC RATING
9th/ 347
METRIC RANK
38.4%
ASSOCIATE'S DEGREE
0.0/ 100
METRIC RATING
307th/ 347
METRIC RANK
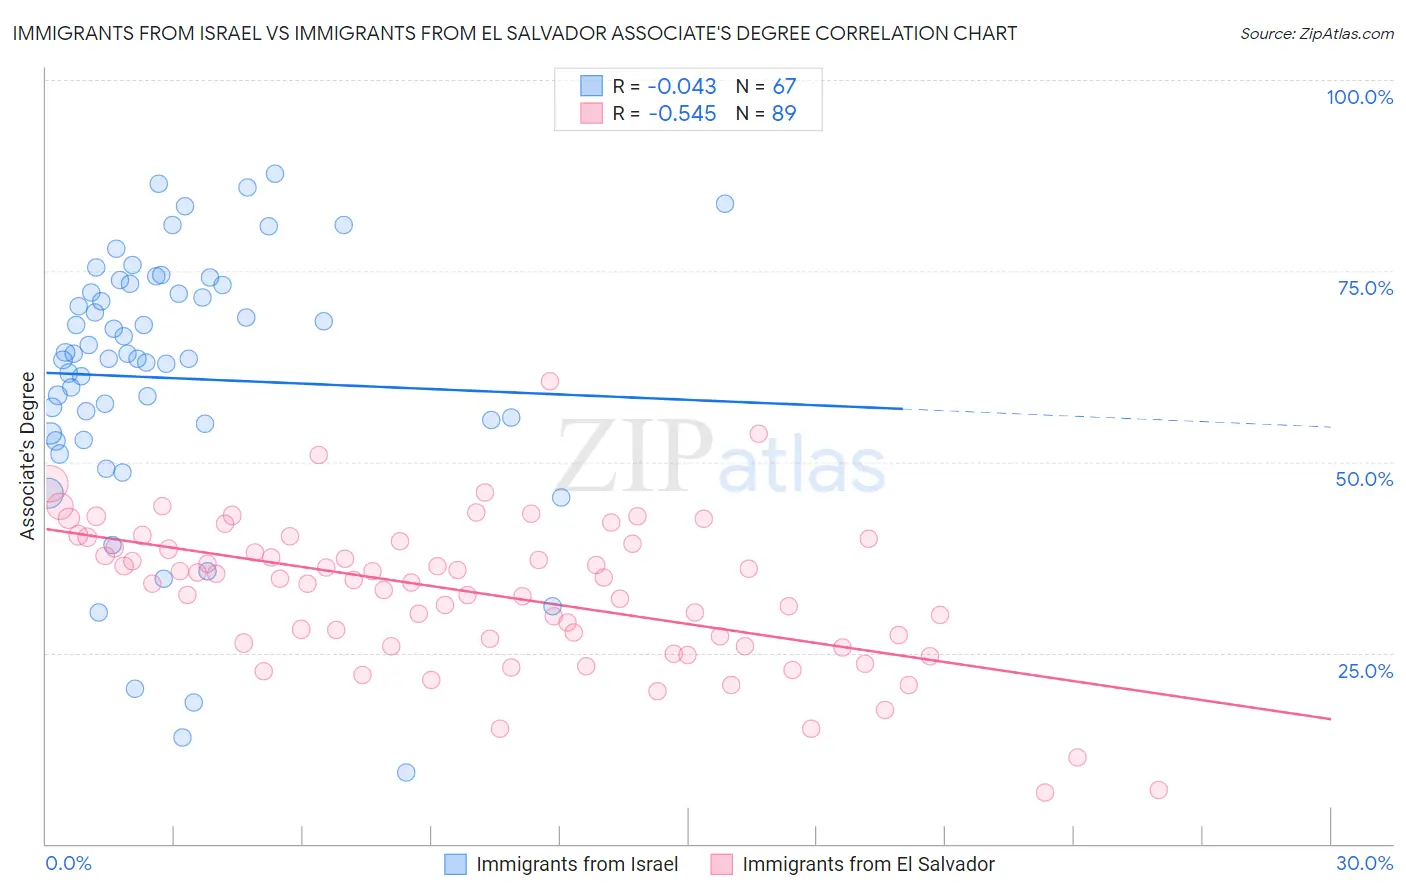
Immigrants from Israel vs Immigrants from El Salvador Associate's Degree Correlation Chart
The statistical analysis conducted on geographies consisting of 210,027,202 people shows no correlation between the proportion of Immigrants from Israel and percentage of population with at least associate's degree education in the United States with a correlation coefficient (R) of -0.043 and weighted average of 56.8%. Similarly, the statistical analysis conducted on geographies consisting of 357,840,012 people shows a substantial negative correlation between the proportion of Immigrants from El Salvador and percentage of population with at least associate's degree education in the United States with a correlation coefficient (R) of -0.545 and weighted average of 38.4%, a difference of 47.8%.
Associate's Degree Correlation Summary
| Measurement | Immigrants from Israel | Immigrants from El Salvador |
| Minimum | 9.3% | 6.6% |
| Maximum | 87.7% | 60.5% |
| Range | 78.4% | 53.9% |
| Mean | 61.0% | 32.9% |
| Median | 63.5% | 34.5% |
| Interquartile 25% (IQ1) | 53.7% | 26.1% |
| Interquartile 75% (IQ3) | 73.2% | 39.4% |
| Interquartile Range (IQR) | 19.5% | 13.3% |
| Standard Deviation (Sample) | 17.4% | 9.6% |
| Standard Deviation (Population) | 17.3% | 9.6% |
Similar Demographics by Associate's Degree
Demographics Similar to Immigrants from Israel by Associate's Degree
In terms of associate's degree, the demographic groups most similar to Immigrants from Israel are Cypriot (56.4%, a difference of 0.72%), Thai (57.4%, a difference of 1.1%), Immigrants from Iran (57.7%, a difference of 1.5%), Okinawan (57.7%, a difference of 1.6%), and Immigrants from Australia (55.8%, a difference of 1.8%).
| Demographics | Rating | Rank | Associate's Degree |
| Immigrants | Singapore | 100.0 /100 | #2 | Exceptional 58.9% |
| Immigrants | India | 100.0 /100 | #3 | Exceptional 58.5% |
| Immigrants | Taiwan | 100.0 /100 | #4 | Exceptional 58.4% |
| Iranians | 100.0 /100 | #5 | Exceptional 58.2% |
| Okinawans | 100.0 /100 | #6 | Exceptional 57.7% |
| Immigrants | Iran | 100.0 /100 | #7 | Exceptional 57.7% |
| Thais | 100.0 /100 | #8 | Exceptional 57.4% |
| Immigrants | Israel | 100.0 /100 | #9 | Exceptional 56.8% |
| Cypriots | 100.0 /100 | #10 | Exceptional 56.4% |
| Immigrants | Australia | 100.0 /100 | #11 | Exceptional 55.8% |
| Immigrants | South Central Asia | 100.0 /100 | #12 | Exceptional 55.7% |
| Immigrants | China | 100.0 /100 | #13 | Exceptional 55.5% |
| Immigrants | Hong Kong | 100.0 /100 | #14 | Exceptional 55.4% |
| Immigrants | Eastern Asia | 100.0 /100 | #15 | Exceptional 55.4% |
| Soviet Union | 100.0 /100 | #16 | Exceptional 55.1% |
Demographics Similar to Immigrants from El Salvador by Associate's Degree
In terms of associate's degree, the demographic groups most similar to Immigrants from El Salvador are Shoshone (38.4%, a difference of 0.040%), Immigrants from Honduras (38.5%, a difference of 0.11%), Sioux (38.5%, a difference of 0.17%), Guatemalan (38.5%, a difference of 0.23%), and Colville (38.5%, a difference of 0.31%).
| Demographics | Rating | Rank | Associate's Degree |
| Chickasaw | 0.0 /100 | #300 | Tragic 38.6% |
| Tsimshian | 0.0 /100 | #301 | Tragic 38.6% |
| Colville | 0.0 /100 | #302 | Tragic 38.5% |
| Guatemalans | 0.0 /100 | #303 | Tragic 38.5% |
| Sioux | 0.0 /100 | #304 | Tragic 38.5% |
| Immigrants | Honduras | 0.0 /100 | #305 | Tragic 38.5% |
| Shoshone | 0.0 /100 | #306 | Tragic 38.4% |
| Immigrants | El Salvador | 0.0 /100 | #307 | Tragic 38.4% |
| Mexican American Indians | 0.0 /100 | #308 | Tragic 38.2% |
| Immigrants | Guatemala | 0.0 /100 | #309 | Tragic 38.1% |
| Immigrants | Dominican Republic | 0.0 /100 | #310 | Tragic 37.9% |
| Immigrants | Latin America | 0.0 /100 | #311 | Tragic 37.9% |
| Choctaw | 0.0 /100 | #312 | Tragic 37.8% |
| Hispanics or Latinos | 0.0 /100 | #313 | Tragic 37.7% |
| Seminole | 0.0 /100 | #314 | Tragic 37.7% |