Immigrants from Israel vs Immigrants from North Macedonia Associate's Degree
COMPARE
Immigrants from Israel
Immigrants from North Macedonia
Associate's Degree
Associate's Degree Comparison
Immigrants from Israel
Immigrants from North Macedonia
56.8%
ASSOCIATE'S DEGREE
100.0/ 100
METRIC RATING
9th/ 347
METRIC RANK
47.4%
ASSOCIATE'S DEGREE
76.0/ 100
METRIC RATING
151st/ 347
METRIC RANK
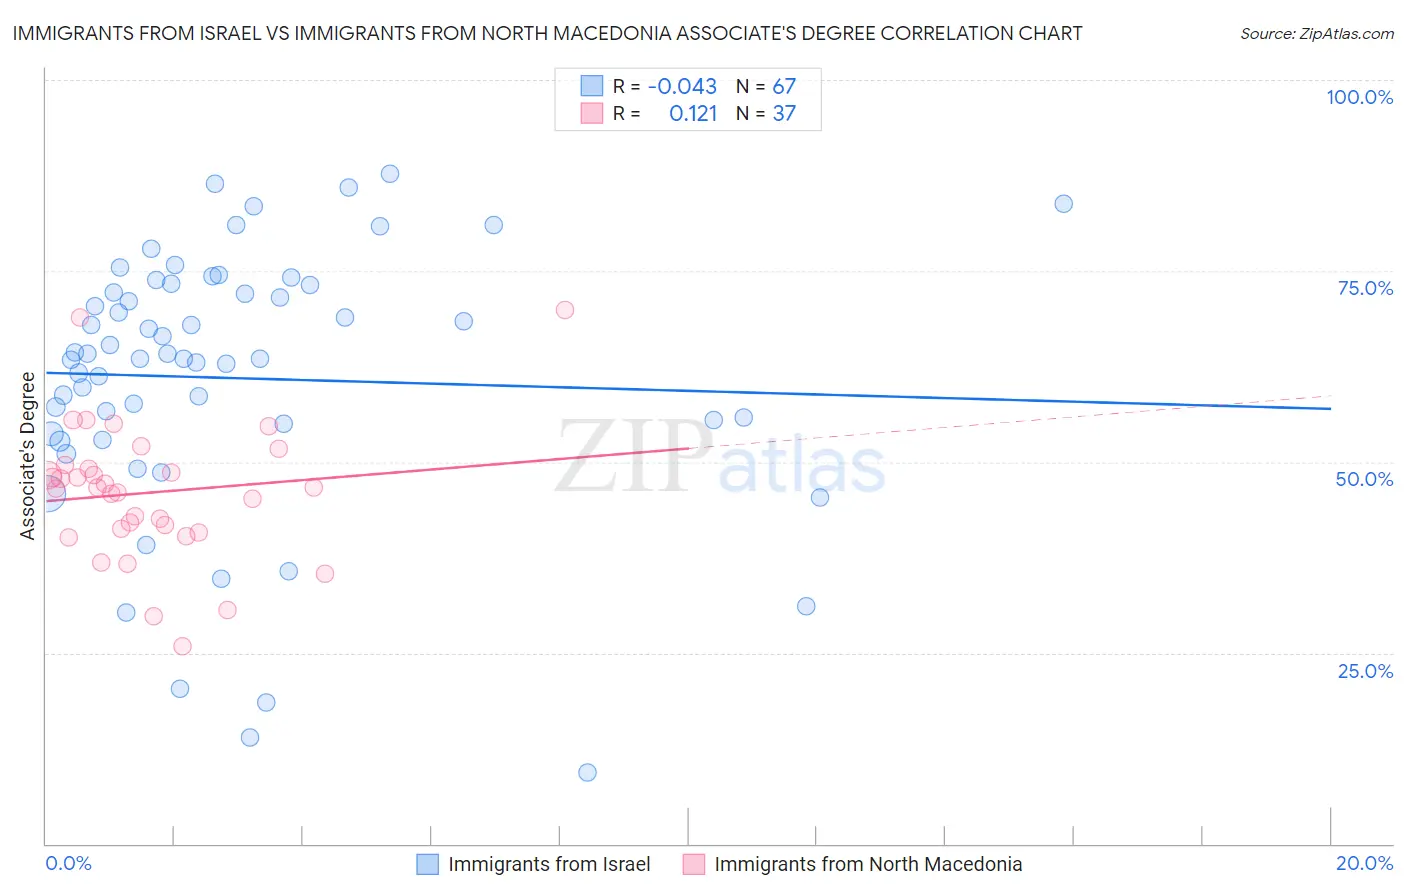
Immigrants from Israel vs Immigrants from North Macedonia Associate's Degree Correlation Chart
The statistical analysis conducted on geographies consisting of 210,027,202 people shows no correlation between the proportion of Immigrants from Israel and percentage of population with at least associate's degree education in the United States with a correlation coefficient (R) of -0.043 and weighted average of 56.8%. Similarly, the statistical analysis conducted on geographies consisting of 74,317,045 people shows a poor positive correlation between the proportion of Immigrants from North Macedonia and percentage of population with at least associate's degree education in the United States with a correlation coefficient (R) of 0.121 and weighted average of 47.4%, a difference of 19.9%.
Associate's Degree Correlation Summary
| Measurement | Immigrants from Israel | Immigrants from North Macedonia |
| Minimum | 9.3% | 25.9% |
| Maximum | 87.7% | 69.8% |
| Range | 78.4% | 43.9% |
| Mean | 61.0% | 46.0% |
| Median | 63.5% | 46.6% |
| Interquartile 25% (IQ1) | 53.7% | 41.0% |
| Interquartile 75% (IQ3) | 73.2% | 49.3% |
| Interquartile Range (IQR) | 19.5% | 8.3% |
| Standard Deviation (Sample) | 17.4% | 9.0% |
| Standard Deviation (Population) | 17.3% | 8.9% |
Similar Demographics by Associate's Degree
Demographics Similar to Immigrants from Israel by Associate's Degree
In terms of associate's degree, the demographic groups most similar to Immigrants from Israel are Cypriot (56.4%, a difference of 0.72%), Thai (57.4%, a difference of 1.1%), Immigrants from Iran (57.7%, a difference of 1.5%), Okinawan (57.7%, a difference of 1.6%), and Immigrants from Australia (55.8%, a difference of 1.8%).
| Demographics | Rating | Rank | Associate's Degree |
| Immigrants | Singapore | 100.0 /100 | #2 | Exceptional 58.9% |
| Immigrants | India | 100.0 /100 | #3 | Exceptional 58.5% |
| Immigrants | Taiwan | 100.0 /100 | #4 | Exceptional 58.4% |
| Iranians | 100.0 /100 | #5 | Exceptional 58.2% |
| Okinawans | 100.0 /100 | #6 | Exceptional 57.7% |
| Immigrants | Iran | 100.0 /100 | #7 | Exceptional 57.7% |
| Thais | 100.0 /100 | #8 | Exceptional 57.4% |
| Immigrants | Israel | 100.0 /100 | #9 | Exceptional 56.8% |
| Cypriots | 100.0 /100 | #10 | Exceptional 56.4% |
| Immigrants | Australia | 100.0 /100 | #11 | Exceptional 55.8% |
| Immigrants | South Central Asia | 100.0 /100 | #12 | Exceptional 55.7% |
| Immigrants | China | 100.0 /100 | #13 | Exceptional 55.5% |
| Immigrants | Hong Kong | 100.0 /100 | #14 | Exceptional 55.4% |
| Immigrants | Eastern Asia | 100.0 /100 | #15 | Exceptional 55.4% |
| Soviet Union | 100.0 /100 | #16 | Exceptional 55.1% |
Demographics Similar to Immigrants from North Macedonia by Associate's Degree
In terms of associate's degree, the demographic groups most similar to Immigrants from North Macedonia are Iraqi (47.4%, a difference of 0.020%), Immigrants from Armenia (47.4%, a difference of 0.060%), South American Indian (47.4%, a difference of 0.070%), Danish (47.4%, a difference of 0.14%), and Immigrants from Afghanistan (47.3%, a difference of 0.17%).
| Demographics | Rating | Rank | Associate's Degree |
| Slavs | 80.5 /100 | #144 | Excellent 47.6% |
| Canadians | 79.0 /100 | #145 | Good 47.5% |
| Immigrants | Sudan | 77.9 /100 | #146 | Good 47.4% |
| Danes | 77.3 /100 | #147 | Good 47.4% |
| South American Indians | 76.7 /100 | #148 | Good 47.4% |
| Immigrants | Armenia | 76.6 /100 | #149 | Good 47.4% |
| Iraqis | 76.2 /100 | #150 | Good 47.4% |
| Immigrants | North Macedonia | 76.0 /100 | #151 | Good 47.4% |
| Immigrants | Afghanistan | 74.3 /100 | #152 | Good 47.3% |
| Czechs | 72.2 /100 | #153 | Good 47.2% |
| Immigrants | Kenya | 72.1 /100 | #154 | Good 47.2% |
| Kenyans | 70.6 /100 | #155 | Good 47.1% |
| South Americans | 70.5 /100 | #156 | Good 47.1% |
| Sudanese | 70.3 /100 | #157 | Good 47.1% |
| Immigrants | Germany | 69.7 /100 | #158 | Good 47.1% |