Immigrants from Ireland vs Zimbabwean Householder Income Ages 25 - 44 years
COMPARE
Immigrants from Ireland
Zimbabwean
Householder Income Ages 25 - 44 years
Householder Income Ages 25 - 44 years Comparison
Immigrants from Ireland
Zimbabweans
$120,333
HOUSEHOLDER INCOME AGES 25 - 44 YEARS
100.0/ 100
METRIC RATING
7th/ 347
METRIC RANK
$98,586
HOUSEHOLDER INCOME AGES 25 - 44 YEARS
90.3/ 100
METRIC RATING
124th/ 347
METRIC RANK
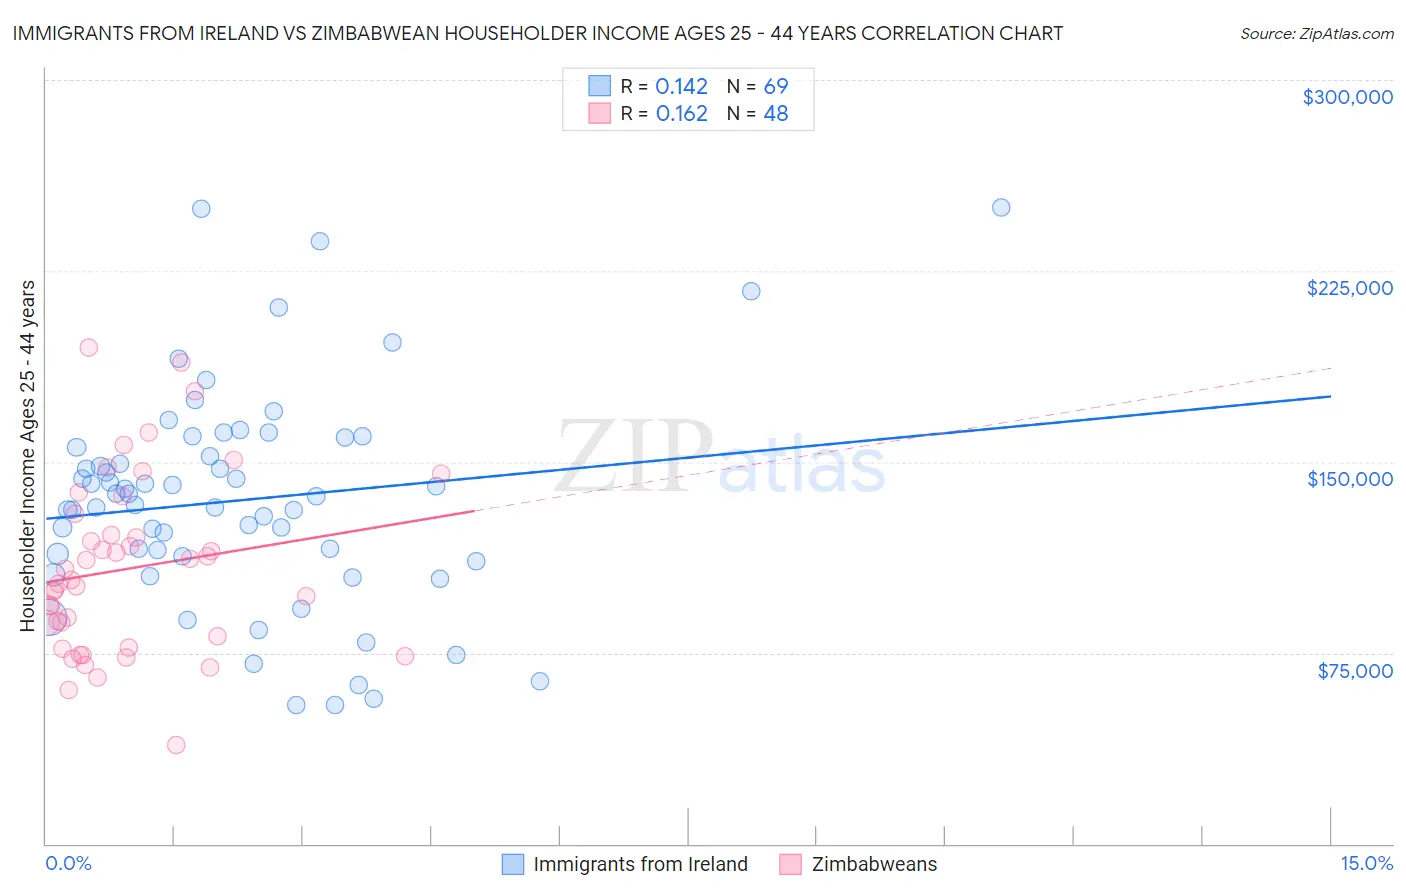
Immigrants from Ireland vs Zimbabwean Householder Income Ages 25 - 44 years Correlation Chart
The statistical analysis conducted on geographies consisting of 240,342,740 people shows a poor positive correlation between the proportion of Immigrants from Ireland and household income with householder between the ages 25 and 44 in the United States with a correlation coefficient (R) of 0.142 and weighted average of $120,333. Similarly, the statistical analysis conducted on geographies consisting of 69,182,537 people shows a poor positive correlation between the proportion of Zimbabweans and household income with householder between the ages 25 and 44 in the United States with a correlation coefficient (R) of 0.162 and weighted average of $98,586, a difference of 22.1%.
Householder Income Ages 25 - 44 years Correlation Summary
| Measurement | Immigrants from Ireland | Zimbabwean |
| Minimum | $54,479 | $38,611 |
| Maximum | $250,001 | $194,972 |
| Range | $195,522 | $156,361 |
| Mean | $134,959 | $108,063 |
| Median | $136,656 | $102,697 |
| Interquartile 25% (IQ1) | $112,137 | $79,354 |
| Interquartile 75% (IQ3) | $157,677 | $125,334 |
| Interquartile Range (IQR) | $45,540 | $45,980 |
| Standard Deviation (Sample) | $42,676 | $34,623 |
| Standard Deviation (Population) | $42,366 | $34,261 |
Similar Demographics by Householder Income Ages 25 - 44 years
Demographics Similar to Immigrants from Ireland by Householder Income Ages 25 - 44 years
In terms of householder income ages 25 - 44 years, the demographic groups most similar to Immigrants from Ireland are Iranian ($120,292, a difference of 0.030%), Immigrants from China ($119,756, a difference of 0.48%), Indian (Asian) ($119,496, a difference of 0.70%), Okinawan ($119,349, a difference of 0.82%), and Immigrants from Iran ($119,204, a difference of 0.95%).
| Demographics | Rating | Rank | Householder Income Ages 25 - 44 years |
| Immigrants | Taiwan | 100.0 /100 | #1 | Exceptional $129,122 |
| Filipinos | 100.0 /100 | #2 | Exceptional $128,723 |
| Immigrants | Hong Kong | 100.0 /100 | #3 | Exceptional $128,140 |
| Immigrants | Singapore | 100.0 /100 | #4 | Exceptional $124,429 |
| Immigrants | India | 100.0 /100 | #5 | Exceptional $124,238 |
| Thais | 100.0 /100 | #6 | Exceptional $121,778 |
| Immigrants | Ireland | 100.0 /100 | #7 | Exceptional $120,333 |
| Iranians | 100.0 /100 | #8 | Exceptional $120,292 |
| Immigrants | China | 100.0 /100 | #9 | Exceptional $119,756 |
| Indians (Asian) | 100.0 /100 | #10 | Exceptional $119,496 |
| Okinawans | 100.0 /100 | #11 | Exceptional $119,349 |
| Immigrants | Iran | 100.0 /100 | #12 | Exceptional $119,204 |
| Immigrants | Eastern Asia | 100.0 /100 | #13 | Exceptional $118,056 |
| Immigrants | Israel | 100.0 /100 | #14 | Exceptional $117,219 |
| Immigrants | South Central Asia | 100.0 /100 | #15 | Exceptional $116,626 |
Demographics Similar to Zimbabweans by Householder Income Ages 25 - 44 years
In terms of householder income ages 25 - 44 years, the demographic groups most similar to Zimbabweans are Palestinian ($98,777, a difference of 0.19%), Pakistani ($98,401, a difference of 0.19%), British ($98,359, a difference of 0.23%), Immigrants from Uzbekistan ($98,849, a difference of 0.27%), and Serbian ($98,320, a difference of 0.27%).
| Demographics | Rating | Rank | Householder Income Ages 25 - 44 years |
| Immigrants | Northern Africa | 93.0 /100 | #117 | Exceptional $99,232 |
| Syrians | 92.9 /100 | #118 | Exceptional $99,215 |
| Jordanians | 92.8 /100 | #119 | Exceptional $99,186 |
| Swedes | 92.7 /100 | #120 | Exceptional $99,136 |
| Peruvians | 91.7 /100 | #121 | Exceptional $98,886 |
| Immigrants | Uzbekistan | 91.5 /100 | #122 | Exceptional $98,849 |
| Palestinians | 91.2 /100 | #123 | Exceptional $98,777 |
| Zimbabweans | 90.3 /100 | #124 | Exceptional $98,586 |
| Pakistanis | 89.3 /100 | #125 | Excellent $98,401 |
| British | 89.1 /100 | #126 | Excellent $98,359 |
| Serbians | 88.9 /100 | #127 | Excellent $98,320 |
| Europeans | 88.9 /100 | #128 | Excellent $98,310 |
| Brazilians | 88.6 /100 | #129 | Excellent $98,267 |
| Immigrants | Kuwait | 87.8 /100 | #130 | Excellent $98,122 |
| Immigrants | Albania | 86.6 /100 | #131 | Excellent $97,929 |