Immigrants from Ireland vs Immigrants from Bolivia Master's Degree
COMPARE
Immigrants from Ireland
Immigrants from Bolivia
Master's Degree
Master's Degree Comparison
Immigrants from Ireland
Immigrants from Bolivia
20.4%
MASTER'S DEGREE
100.0/ 100
METRIC RATING
21st/ 347
METRIC RANK
19.1%
MASTER'S DEGREE
100.0/ 100
METRIC RATING
40th/ 347
METRIC RANK
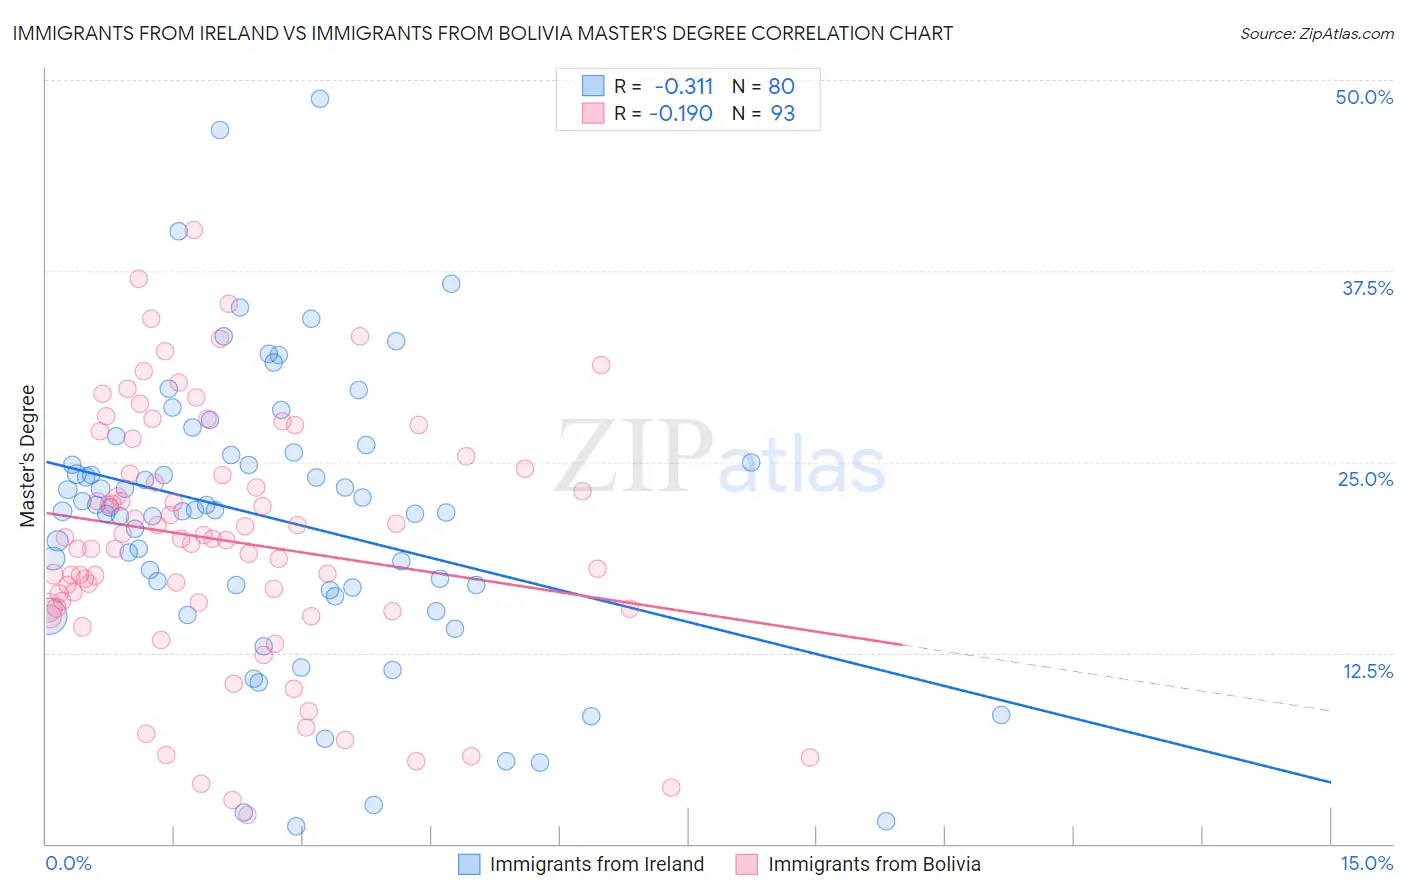
Immigrants from Ireland vs Immigrants from Bolivia Master's Degree Correlation Chart
The statistical analysis conducted on geographies consisting of 240,764,624 people shows a mild negative correlation between the proportion of Immigrants from Ireland and percentage of population with at least master's degree education in the United States with a correlation coefficient (R) of -0.311 and weighted average of 20.4%. Similarly, the statistical analysis conducted on geographies consisting of 158,724,078 people shows a poor negative correlation between the proportion of Immigrants from Bolivia and percentage of population with at least master's degree education in the United States with a correlation coefficient (R) of -0.190 and weighted average of 19.1%, a difference of 6.9%.
Master's Degree Correlation Summary
| Measurement | Immigrants from Ireland | Immigrants from Bolivia |
| Minimum | 1.1% | 1.9% |
| Maximum | 48.7% | 40.2% |
| Range | 47.6% | 38.3% |
| Mean | 21.3% | 19.9% |
| Median | 21.8% | 19.9% |
| Interquartile 25% (IQ1) | 16.7% | 15.5% |
| Interquartile 75% (IQ3) | 25.5% | 25.0% |
| Interquartile Range (IQR) | 8.8% | 9.5% |
| Standard Deviation (Sample) | 9.3% | 8.2% |
| Standard Deviation (Population) | 9.3% | 8.2% |
Demographics Similar to Immigrants from Ireland and Immigrants from Bolivia by Master's Degree
In terms of master's degree, the demographic groups most similar to Immigrants from Ireland are Indian (Asian) (20.5%, a difference of 0.11%), Israeli (20.3%, a difference of 0.42%), Immigrants from France (20.3%, a difference of 0.70%), Immigrants from Sweden (20.3%, a difference of 0.77%), and Immigrants from Japan (20.0%, a difference of 2.1%). Similarly, the demographic groups most similar to Immigrants from Bolivia are Immigrants from Spain (19.1%, a difference of 0.13%), Bolivian (19.3%, a difference of 0.77%), Mongolian (19.4%, a difference of 1.5%), Immigrants from Russia (19.4%, a difference of 1.5%), and Immigrants from Northern Europe (19.5%, a difference of 1.9%).
| Demographics | Rating | Rank | Master's Degree |
| Indians (Asian) | 100.0 /100 | #20 | Exceptional 20.5% |
| Immigrants | Ireland | 100.0 /100 | #21 | Exceptional 20.4% |
| Israelis | 100.0 /100 | #22 | Exceptional 20.3% |
| Immigrants | France | 100.0 /100 | #23 | Exceptional 20.3% |
| Immigrants | Sweden | 100.0 /100 | #24 | Exceptional 20.3% |
| Immigrants | Japan | 100.0 /100 | #25 | Exceptional 20.0% |
| Cambodians | 100.0 /100 | #26 | Exceptional 20.0% |
| Immigrants | Sri Lanka | 100.0 /100 | #27 | Exceptional 19.9% |
| Turks | 100.0 /100 | #28 | Exceptional 19.9% |
| Latvians | 100.0 /100 | #29 | Exceptional 19.8% |
| Immigrants | Turkey | 100.0 /100 | #30 | Exceptional 19.7% |
| Immigrants | Korea | 100.0 /100 | #31 | Exceptional 19.7% |
| Burmese | 100.0 /100 | #32 | Exceptional 19.7% |
| Russians | 100.0 /100 | #33 | Exceptional 19.5% |
| Immigrants | Denmark | 100.0 /100 | #34 | Exceptional 19.5% |
| Immigrants | Northern Europe | 100.0 /100 | #35 | Exceptional 19.5% |
| Immigrants | Russia | 100.0 /100 | #36 | Exceptional 19.4% |
| Mongolians | 100.0 /100 | #37 | Exceptional 19.4% |
| Bolivians | 100.0 /100 | #38 | Exceptional 19.3% |
| Immigrants | Spain | 100.0 /100 | #39 | Exceptional 19.1% |
| Immigrants | Bolivia | 100.0 /100 | #40 | Exceptional 19.1% |