Immigrants from Indonesia vs Celtic Doctorate Degree
COMPARE
Immigrants from Indonesia
Celtic
Doctorate Degree
Doctorate Degree Comparison
Immigrants from Indonesia
Celtics
2.4%
DOCTORATE DEGREE
100.0/ 100
METRIC RATING
54th/ 347
METRIC RANK
1.9%
DOCTORATE DEGREE
66.7/ 100
METRIC RATING
164th/ 347
METRIC RANK
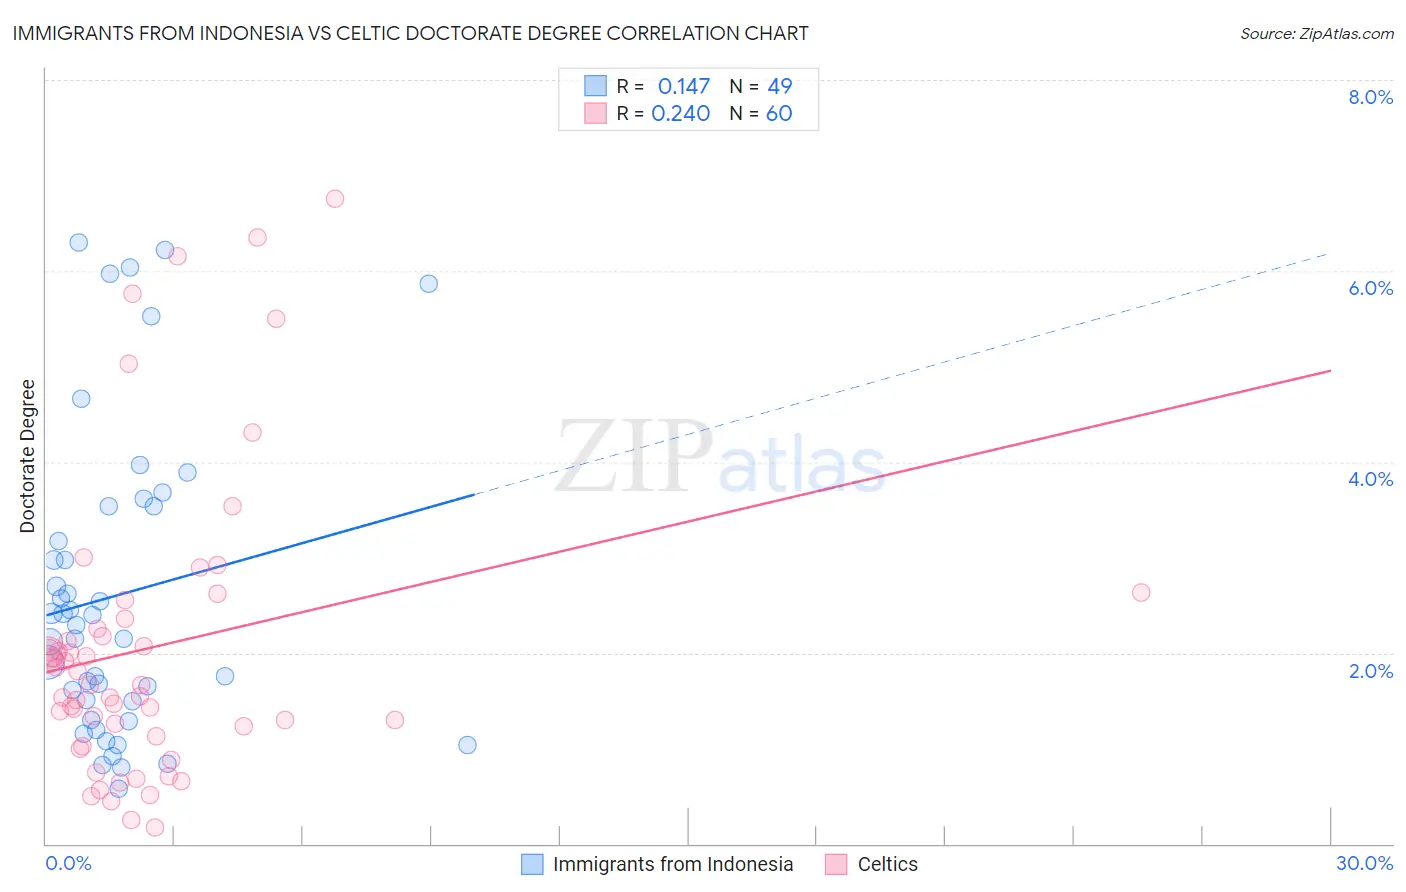
Immigrants from Indonesia vs Celtic Doctorate Degree Correlation Chart
The statistical analysis conducted on geographies consisting of 215,315,104 people shows a poor positive correlation between the proportion of Immigrants from Indonesia and percentage of population with at least doctorate degree education in the United States with a correlation coefficient (R) of 0.147 and weighted average of 2.4%. Similarly, the statistical analysis conducted on geographies consisting of 167,913,023 people shows a weak positive correlation between the proportion of Celtics and percentage of population with at least doctorate degree education in the United States with a correlation coefficient (R) of 0.240 and weighted average of 1.9%, a difference of 25.5%.
Doctorate Degree Correlation Summary
| Measurement | Immigrants from Indonesia | Celtic |
| Minimum | 0.57% | 0.17% |
| Maximum | 6.3% | 6.8% |
| Range | 5.7% | 6.6% |
| Mean | 2.6% | 2.1% |
| Median | 2.3% | 1.7% |
| Interquartile 25% (IQ1) | 1.4% | 1.2% |
| Interquartile 75% (IQ3) | 3.5% | 2.3% |
| Interquartile Range (IQR) | 2.1% | 1.1% |
| Standard Deviation (Sample) | 1.6% | 1.5% |
| Standard Deviation (Population) | 1.6% | 1.5% |
Similar Demographics by Doctorate Degree
Demographics Similar to Immigrants from Indonesia by Doctorate Degree
In terms of doctorate degree, the demographic groups most similar to Immigrants from Indonesia are Bolivian (2.4%, a difference of 0.080%), Immigrants from Czechoslovakia (2.4%, a difference of 0.17%), Immigrants from Ethiopia (2.4%, a difference of 0.61%), Immigrants from Latvia (2.4%, a difference of 0.68%), and Ethiopian (2.3%, a difference of 0.73%).
| Demographics | Rating | Rank | Doctorate Degree |
| Immigrants | Western Europe | 100.0 /100 | #47 | Exceptional 2.4% |
| Asians | 100.0 /100 | #48 | Exceptional 2.4% |
| Immigrants | Asia | 100.0 /100 | #49 | Exceptional 2.4% |
| Immigrants | Norway | 100.0 /100 | #50 | Exceptional 2.4% |
| Australians | 100.0 /100 | #51 | Exceptional 2.4% |
| Bulgarians | 100.0 /100 | #52 | Exceptional 2.4% |
| Immigrants | Latvia | 100.0 /100 | #53 | Exceptional 2.4% |
| Immigrants | Indonesia | 100.0 /100 | #54 | Exceptional 2.4% |
| Bolivians | 100.0 /100 | #55 | Exceptional 2.4% |
| Immigrants | Czechoslovakia | 100.0 /100 | #56 | Exceptional 2.4% |
| Immigrants | Ethiopia | 100.0 /100 | #57 | Exceptional 2.4% |
| Ethiopians | 99.9 /100 | #58 | Exceptional 2.3% |
| South Africans | 99.9 /100 | #59 | Exceptional 2.3% |
| Immigrants | Serbia | 99.9 /100 | #60 | Exceptional 2.3% |
| Bhutanese | 99.9 /100 | #61 | Exceptional 2.3% |
Demographics Similar to Celtics by Doctorate Degree
In terms of doctorate degree, the demographic groups most similar to Celtics are Czech (1.9%, a difference of 0.10%), Irish (1.9%, a difference of 0.13%), Immigrants from Middle Africa (1.9%, a difference of 0.35%), Scotch-Irish (1.9%, a difference of 0.49%), and Welsh (1.9%, a difference of 0.50%).
| Demographics | Rating | Rank | Doctorate Degree |
| Danes | 71.9 /100 | #157 | Good 1.9% |
| Hungarians | 71.7 /100 | #158 | Good 1.9% |
| Slovenes | 70.2 /100 | #159 | Good 1.9% |
| Welsh | 69.7 /100 | #160 | Good 1.9% |
| Immigrants | Middle Africa | 68.8 /100 | #161 | Good 1.9% |
| Irish | 67.5 /100 | #162 | Good 1.9% |
| Czechs | 67.3 /100 | #163 | Good 1.9% |
| Celtics | 66.7 /100 | #164 | Good 1.9% |
| Scotch-Irish | 63.6 /100 | #165 | Good 1.9% |
| Spaniards | 63.5 /100 | #166 | Good 1.9% |
| Macedonians | 60.9 /100 | #167 | Good 1.9% |
| Sri Lankans | 60.3 /100 | #168 | Good 1.9% |
| Vietnamese | 54.8 /100 | #169 | Average 1.9% |
| Costa Ricans | 53.3 /100 | #170 | Average 1.8% |
| Bermudans | 52.1 /100 | #171 | Average 1.8% |