Immigrants from Indonesia vs Ute Doctorate Degree
COMPARE
Immigrants from Indonesia
Ute
Doctorate Degree
Doctorate Degree Comparison
Immigrants from Indonesia
Ute
2.4%
DOCTORATE DEGREE
100.0/ 100
METRIC RATING
54th/ 347
METRIC RANK
2.0%
DOCTORATE DEGREE
93.2/ 100
METRIC RATING
124th/ 347
METRIC RANK
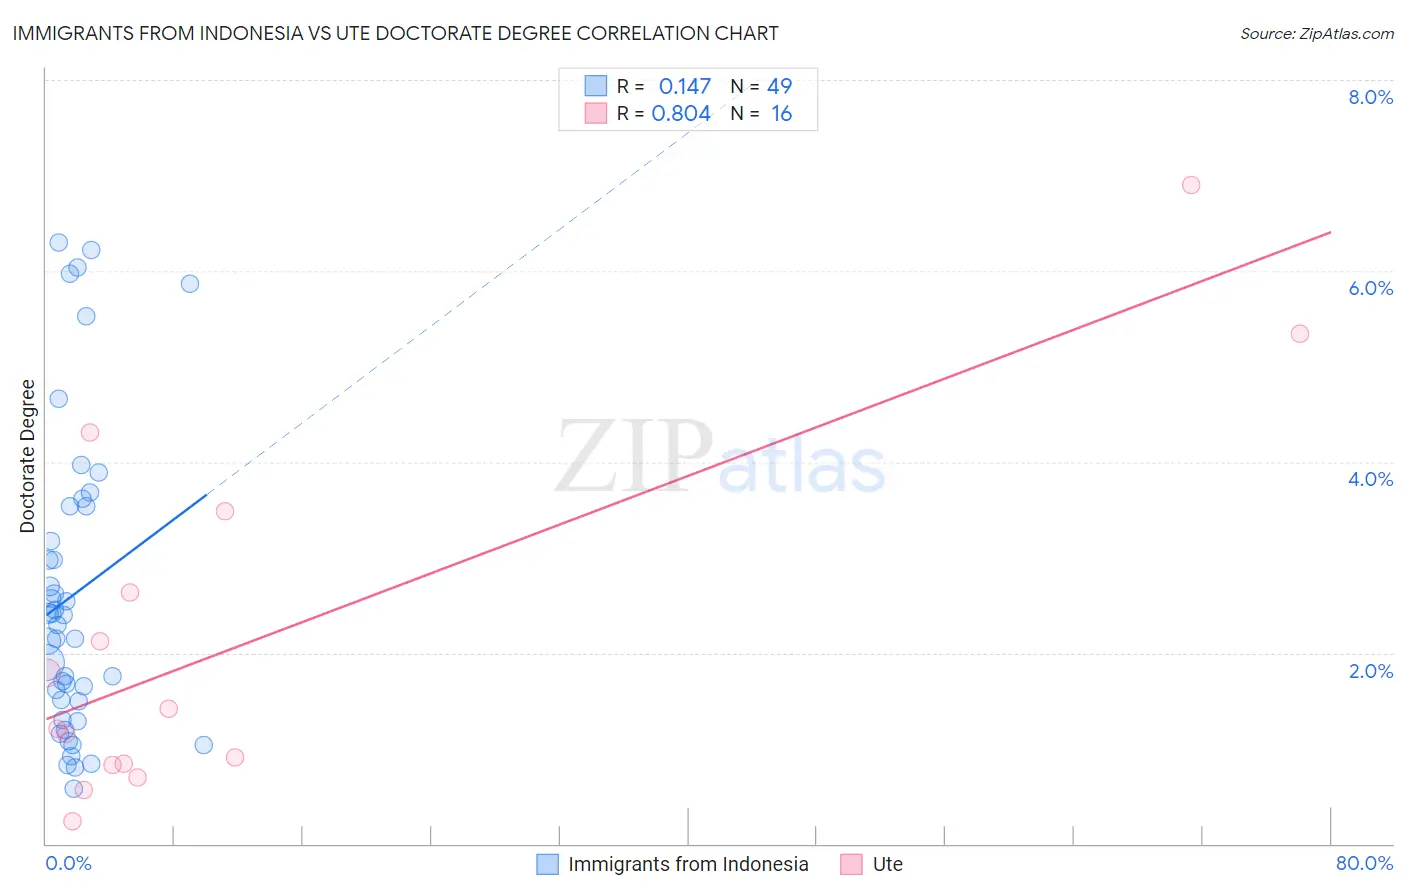
Immigrants from Indonesia vs Ute Doctorate Degree Correlation Chart
The statistical analysis conducted on geographies consisting of 215,315,104 people shows a poor positive correlation between the proportion of Immigrants from Indonesia and percentage of population with at least doctorate degree education in the United States with a correlation coefficient (R) of 0.147 and weighted average of 2.4%. Similarly, the statistical analysis conducted on geographies consisting of 55,479,547 people shows a very strong positive correlation between the proportion of Ute and percentage of population with at least doctorate degree education in the United States with a correlation coefficient (R) of 0.804 and weighted average of 2.0%, a difference of 17.5%.
Doctorate Degree Correlation Summary
| Measurement | Immigrants from Indonesia | Ute |
| Minimum | 0.57% | 0.23% |
| Maximum | 6.3% | 6.9% |
| Range | 5.7% | 6.7% |
| Mean | 2.6% | 2.1% |
| Median | 2.3% | 1.3% |
| Interquartile 25% (IQ1) | 1.4% | 0.83% |
| Interquartile 75% (IQ3) | 3.5% | 3.1% |
| Interquartile Range (IQR) | 2.1% | 2.2% |
| Standard Deviation (Sample) | 1.6% | 1.9% |
| Standard Deviation (Population) | 1.6% | 1.9% |
Similar Demographics by Doctorate Degree
Demographics Similar to Immigrants from Indonesia by Doctorate Degree
In terms of doctorate degree, the demographic groups most similar to Immigrants from Indonesia are Bolivian (2.4%, a difference of 0.080%), Immigrants from Czechoslovakia (2.4%, a difference of 0.17%), Immigrants from Ethiopia (2.4%, a difference of 0.61%), Immigrants from Latvia (2.4%, a difference of 0.68%), and Ethiopian (2.3%, a difference of 0.73%).
| Demographics | Rating | Rank | Doctorate Degree |
| Immigrants | Western Europe | 100.0 /100 | #47 | Exceptional 2.4% |
| Asians | 100.0 /100 | #48 | Exceptional 2.4% |
| Immigrants | Asia | 100.0 /100 | #49 | Exceptional 2.4% |
| Immigrants | Norway | 100.0 /100 | #50 | Exceptional 2.4% |
| Australians | 100.0 /100 | #51 | Exceptional 2.4% |
| Bulgarians | 100.0 /100 | #52 | Exceptional 2.4% |
| Immigrants | Latvia | 100.0 /100 | #53 | Exceptional 2.4% |
| Immigrants | Indonesia | 100.0 /100 | #54 | Exceptional 2.4% |
| Bolivians | 100.0 /100 | #55 | Exceptional 2.4% |
| Immigrants | Czechoslovakia | 100.0 /100 | #56 | Exceptional 2.4% |
| Immigrants | Ethiopia | 100.0 /100 | #57 | Exceptional 2.4% |
| Ethiopians | 99.9 /100 | #58 | Exceptional 2.3% |
| South Africans | 99.9 /100 | #59 | Exceptional 2.3% |
| Immigrants | Serbia | 99.9 /100 | #60 | Exceptional 2.3% |
| Bhutanese | 99.9 /100 | #61 | Exceptional 2.3% |
Demographics Similar to Ute by Doctorate Degree
In terms of doctorate degree, the demographic groups most similar to Ute are Moroccan (2.0%, a difference of 0.11%), Croatian (2.0%, a difference of 0.47%), Jordanian (2.0%, a difference of 0.52%), Palestinian (2.0%, a difference of 0.56%), and Immigrants from Southern Europe (2.0%, a difference of 0.93%).
| Demographics | Rating | Rank | Doctorate Degree |
| Lebanese | 96.0 /100 | #117 | Exceptional 2.1% |
| Icelanders | 96.0 /100 | #118 | Exceptional 2.1% |
| Pakistanis | 95.8 /100 | #119 | Exceptional 2.0% |
| Immigrants | Morocco | 95.5 /100 | #120 | Exceptional 2.0% |
| Immigrants | Jordan | 94.8 /100 | #121 | Exceptional 2.0% |
| Immigrants | Southern Europe | 94.7 /100 | #122 | Exceptional 2.0% |
| Croatians | 94.0 /100 | #123 | Exceptional 2.0% |
| Ute | 93.2 /100 | #124 | Exceptional 2.0% |
| Moroccans | 93.0 /100 | #125 | Exceptional 2.0% |
| Jordanians | 92.1 /100 | #126 | Exceptional 2.0% |
| Palestinians | 92.0 /100 | #127 | Exceptional 2.0% |
| Immigrants | Zaire | 91.1 /100 | #128 | Exceptional 2.0% |
| Canadians | 90.6 /100 | #129 | Exceptional 2.0% |
| Immigrants | Ukraine | 90.5 /100 | #130 | Exceptional 2.0% |
| Immigrants | Sierra Leone | 90.2 /100 | #131 | Exceptional 2.0% |