Immigrants from Indonesia vs Hmong Doctorate Degree
COMPARE
Immigrants from Indonesia
Hmong
Doctorate Degree
Doctorate Degree Comparison
Immigrants from Indonesia
Hmong
2.4%
DOCTORATE DEGREE
100.0/ 100
METRIC RATING
54th/ 347
METRIC RANK
1.6%
DOCTORATE DEGREE
1.8/ 100
METRIC RATING
246th/ 347
METRIC RANK
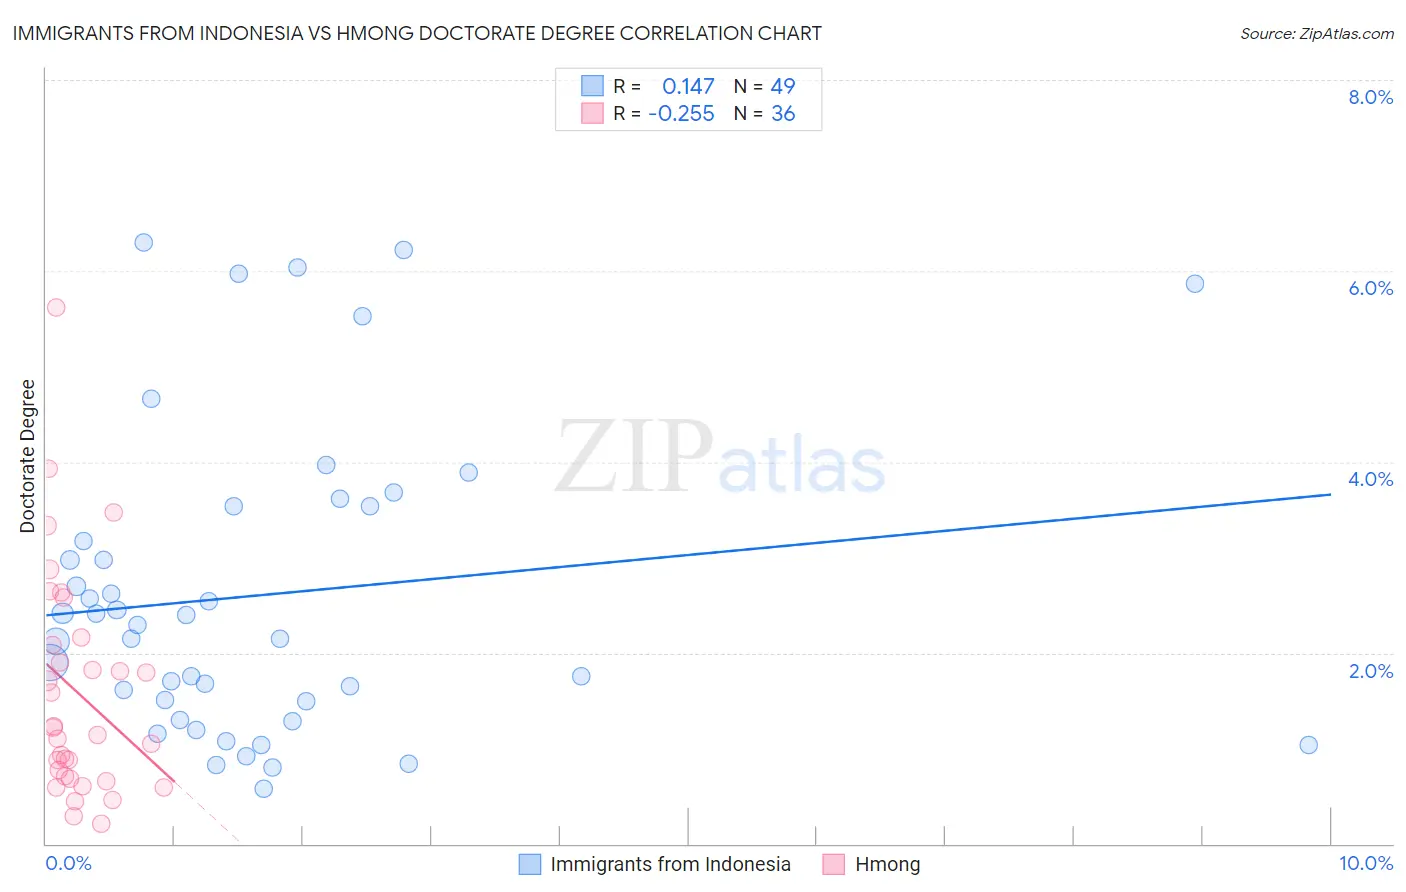
Immigrants from Indonesia vs Hmong Doctorate Degree Correlation Chart
The statistical analysis conducted on geographies consisting of 215,315,104 people shows a poor positive correlation between the proportion of Immigrants from Indonesia and percentage of population with at least doctorate degree education in the United States with a correlation coefficient (R) of 0.147 and weighted average of 2.4%. Similarly, the statistical analysis conducted on geographies consisting of 24,653,481 people shows a weak negative correlation between the proportion of Hmong and percentage of population with at least doctorate degree education in the United States with a correlation coefficient (R) of -0.255 and weighted average of 1.6%, a difference of 50.7%.
Doctorate Degree Correlation Summary
| Measurement | Immigrants from Indonesia | Hmong |
| Minimum | 0.57% | 0.21% |
| Maximum | 6.3% | 5.6% |
| Range | 5.7% | 5.4% |
| Mean | 2.6% | 1.6% |
| Median | 2.3% | 1.2% |
| Interquartile 25% (IQ1) | 1.4% | 0.69% |
| Interquartile 75% (IQ3) | 3.5% | 2.1% |
| Interquartile Range (IQR) | 2.1% | 1.4% |
| Standard Deviation (Sample) | 1.6% | 1.2% |
| Standard Deviation (Population) | 1.6% | 1.2% |
Similar Demographics by Doctorate Degree
Demographics Similar to Immigrants from Indonesia by Doctorate Degree
In terms of doctorate degree, the demographic groups most similar to Immigrants from Indonesia are Bolivian (2.4%, a difference of 0.080%), Immigrants from Czechoslovakia (2.4%, a difference of 0.17%), Immigrants from Ethiopia (2.4%, a difference of 0.61%), Immigrants from Latvia (2.4%, a difference of 0.68%), and Ethiopian (2.3%, a difference of 0.73%).
| Demographics | Rating | Rank | Doctorate Degree |
| Immigrants | Western Europe | 100.0 /100 | #47 | Exceptional 2.4% |
| Asians | 100.0 /100 | #48 | Exceptional 2.4% |
| Immigrants | Asia | 100.0 /100 | #49 | Exceptional 2.4% |
| Immigrants | Norway | 100.0 /100 | #50 | Exceptional 2.4% |
| Australians | 100.0 /100 | #51 | Exceptional 2.4% |
| Bulgarians | 100.0 /100 | #52 | Exceptional 2.4% |
| Immigrants | Latvia | 100.0 /100 | #53 | Exceptional 2.4% |
| Immigrants | Indonesia | 100.0 /100 | #54 | Exceptional 2.4% |
| Bolivians | 100.0 /100 | #55 | Exceptional 2.4% |
| Immigrants | Czechoslovakia | 100.0 /100 | #56 | Exceptional 2.4% |
| Immigrants | Ethiopia | 100.0 /100 | #57 | Exceptional 2.4% |
| Ethiopians | 99.9 /100 | #58 | Exceptional 2.3% |
| South Africans | 99.9 /100 | #59 | Exceptional 2.3% |
| Immigrants | Serbia | 99.9 /100 | #60 | Exceptional 2.3% |
| Bhutanese | 99.9 /100 | #61 | Exceptional 2.3% |
Demographics Similar to Hmong by Doctorate Degree
In terms of doctorate degree, the demographic groups most similar to Hmong are Comanche (1.6%, a difference of 0.020%), Delaware (1.6%, a difference of 0.10%), African (1.6%, a difference of 0.14%), French American Indian (1.6%, a difference of 0.47%), and Potawatomi (1.6%, a difference of 0.61%).
| Demographics | Rating | Rank | Doctorate Degree |
| West Indians | 2.5 /100 | #239 | Tragic 1.6% |
| Immigrants | Panama | 2.4 /100 | #240 | Tragic 1.6% |
| Cheyenne | 2.3 /100 | #241 | Tragic 1.6% |
| Ottawa | 2.2 /100 | #242 | Tragic 1.6% |
| Native Hawaiians | 2.1 /100 | #243 | Tragic 1.6% |
| French American Indians | 2.0 /100 | #244 | Tragic 1.6% |
| Delaware | 1.9 /100 | #245 | Tragic 1.6% |
| Hmong | 1.8 /100 | #246 | Tragic 1.6% |
| Comanche | 1.8 /100 | #247 | Tragic 1.6% |
| Africans | 1.8 /100 | #248 | Tragic 1.6% |
| Potawatomi | 1.6 /100 | #249 | Tragic 1.6% |
| Immigrants | Fiji | 1.6 /100 | #250 | Tragic 1.6% |
| Apache | 1.3 /100 | #251 | Tragic 1.5% |
| Yuman | 1.1 /100 | #252 | Tragic 1.5% |
| Americans | 1.0 /100 | #253 | Tragic 1.5% |