Hawaiian vs Celtic Doctorate Degree
COMPARE
Hawaiian
Celtic
Doctorate Degree
Doctorate Degree Comparison
Hawaiians
Celtics
1.5%
DOCTORATE DEGREE
0.4/ 100
METRIC RATING
278th/ 347
METRIC RANK
1.9%
DOCTORATE DEGREE
66.7/ 100
METRIC RATING
164th/ 347
METRIC RANK
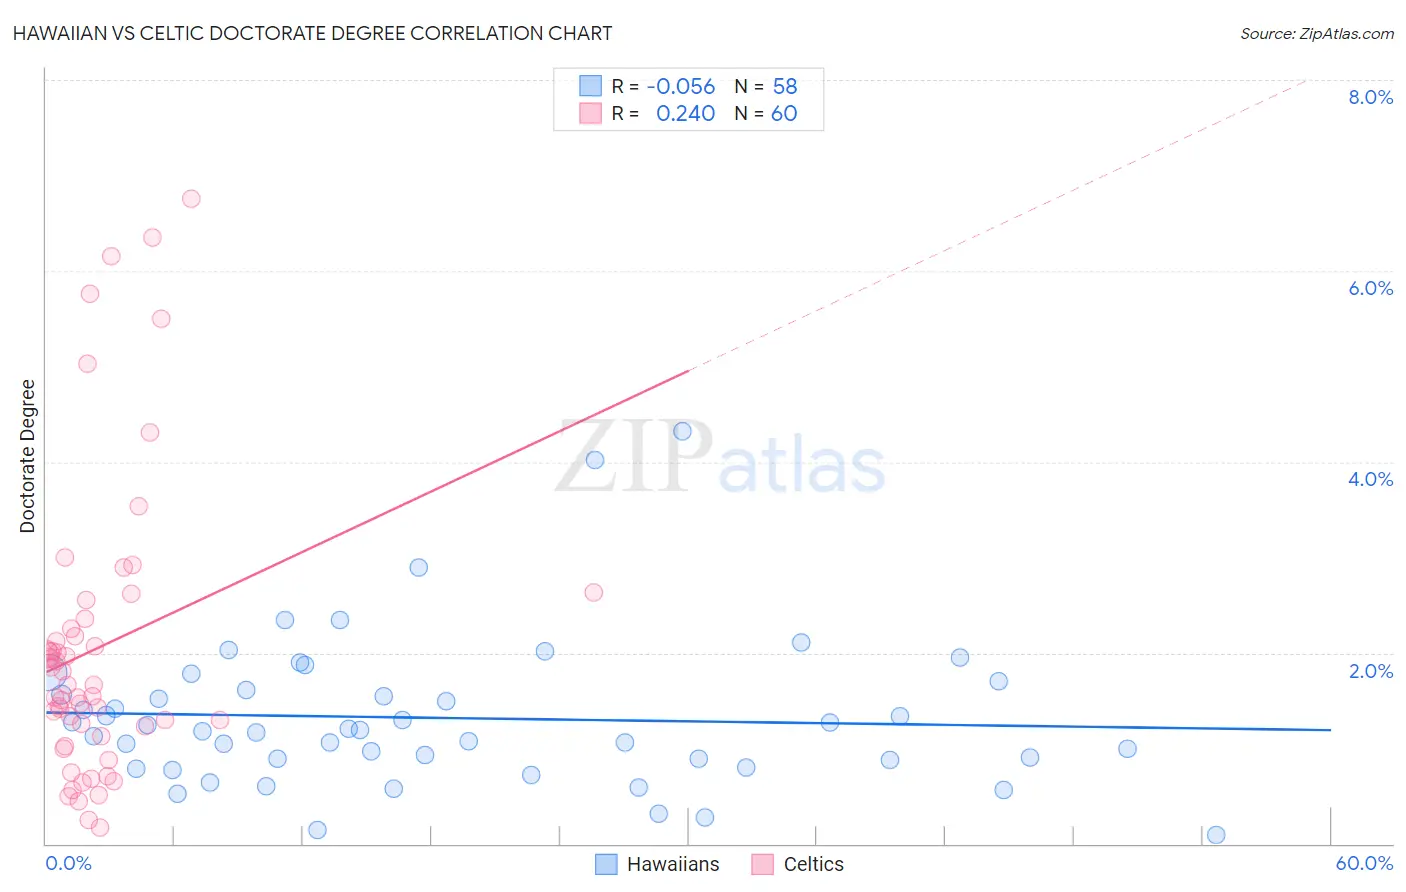
Hawaiian vs Celtic Doctorate Degree Correlation Chart
The statistical analysis conducted on geographies consisting of 323,773,151 people shows a slight negative correlation between the proportion of Hawaiians and percentage of population with at least doctorate degree education in the United States with a correlation coefficient (R) of -0.056 and weighted average of 1.5%. Similarly, the statistical analysis conducted on geographies consisting of 167,913,023 people shows a weak positive correlation between the proportion of Celtics and percentage of population with at least doctorate degree education in the United States with a correlation coefficient (R) of 0.240 and weighted average of 1.9%, a difference of 28.9%.
Doctorate Degree Correlation Summary
| Measurement | Hawaiian | Celtic |
| Minimum | 0.092% | 0.17% |
| Maximum | 4.3% | 6.8% |
| Range | 4.2% | 6.6% |
| Mean | 1.3% | 2.1% |
| Median | 1.2% | 1.7% |
| Interquartile 25% (IQ1) | 0.88% | 1.2% |
| Interquartile 75% (IQ3) | 1.6% | 2.3% |
| Interquartile Range (IQR) | 0.73% | 1.1% |
| Standard Deviation (Sample) | 0.79% | 1.5% |
| Standard Deviation (Population) | 0.78% | 1.5% |
Similar Demographics by Doctorate Degree
Demographics Similar to Hawaiians by Doctorate Degree
In terms of doctorate degree, the demographic groups most similar to Hawaiians are Bahamian (1.5%, a difference of 0.060%), Marshallese (1.5%, a difference of 0.22%), Ecuadorian (1.5%, a difference of 0.23%), Tohono O'odham (1.5%, a difference of 0.30%), and British West Indian (1.5%, a difference of 0.35%).
| Demographics | Rating | Rank | Doctorate Degree |
| Immigrants | Trinidad and Tobago | 0.5 /100 | #271 | Tragic 1.5% |
| Immigrants | Barbados | 0.4 /100 | #272 | Tragic 1.5% |
| Sioux | 0.4 /100 | #273 | Tragic 1.5% |
| Yaqui | 0.4 /100 | #274 | Tragic 1.5% |
| Aleuts | 0.4 /100 | #275 | Tragic 1.5% |
| Paiute | 0.4 /100 | #276 | Tragic 1.5% |
| Bahamians | 0.4 /100 | #277 | Tragic 1.5% |
| Hawaiians | 0.4 /100 | #278 | Tragic 1.5% |
| Marshallese | 0.4 /100 | #279 | Tragic 1.5% |
| Ecuadorians | 0.4 /100 | #280 | Tragic 1.5% |
| Tohono O'odham | 0.4 /100 | #281 | Tragic 1.5% |
| British West Indians | 0.3 /100 | #282 | Tragic 1.5% |
| Central Americans | 0.3 /100 | #283 | Tragic 1.5% |
| Jamaicans | 0.3 /100 | #284 | Tragic 1.5% |
| Malaysians | 0.3 /100 | #285 | Tragic 1.5% |
Demographics Similar to Celtics by Doctorate Degree
In terms of doctorate degree, the demographic groups most similar to Celtics are Czech (1.9%, a difference of 0.10%), Irish (1.9%, a difference of 0.13%), Immigrants from Middle Africa (1.9%, a difference of 0.35%), Scotch-Irish (1.9%, a difference of 0.49%), and Welsh (1.9%, a difference of 0.50%).
| Demographics | Rating | Rank | Doctorate Degree |
| Danes | 71.9 /100 | #157 | Good 1.9% |
| Hungarians | 71.7 /100 | #158 | Good 1.9% |
| Slovenes | 70.2 /100 | #159 | Good 1.9% |
| Welsh | 69.7 /100 | #160 | Good 1.9% |
| Immigrants | Middle Africa | 68.8 /100 | #161 | Good 1.9% |
| Irish | 67.5 /100 | #162 | Good 1.9% |
| Czechs | 67.3 /100 | #163 | Good 1.9% |
| Celtics | 66.7 /100 | #164 | Good 1.9% |
| Scotch-Irish | 63.6 /100 | #165 | Good 1.9% |
| Spaniards | 63.5 /100 | #166 | Good 1.9% |
| Macedonians | 60.9 /100 | #167 | Good 1.9% |
| Sri Lankans | 60.3 /100 | #168 | Good 1.9% |
| Vietnamese | 54.8 /100 | #169 | Average 1.9% |
| Costa Ricans | 53.3 /100 | #170 | Average 1.8% |
| Bermudans | 52.1 /100 | #171 | Average 1.8% |