Immigrants from Guatemala vs Celtic Doctorate Degree
COMPARE
Immigrants from Guatemala
Celtic
Doctorate Degree
Doctorate Degree Comparison
Immigrants from Guatemala
Celtics
1.4%
DOCTORATE DEGREE
0.1/ 100
METRIC RATING
300th/ 347
METRIC RANK
1.9%
DOCTORATE DEGREE
66.7/ 100
METRIC RATING
164th/ 347
METRIC RANK
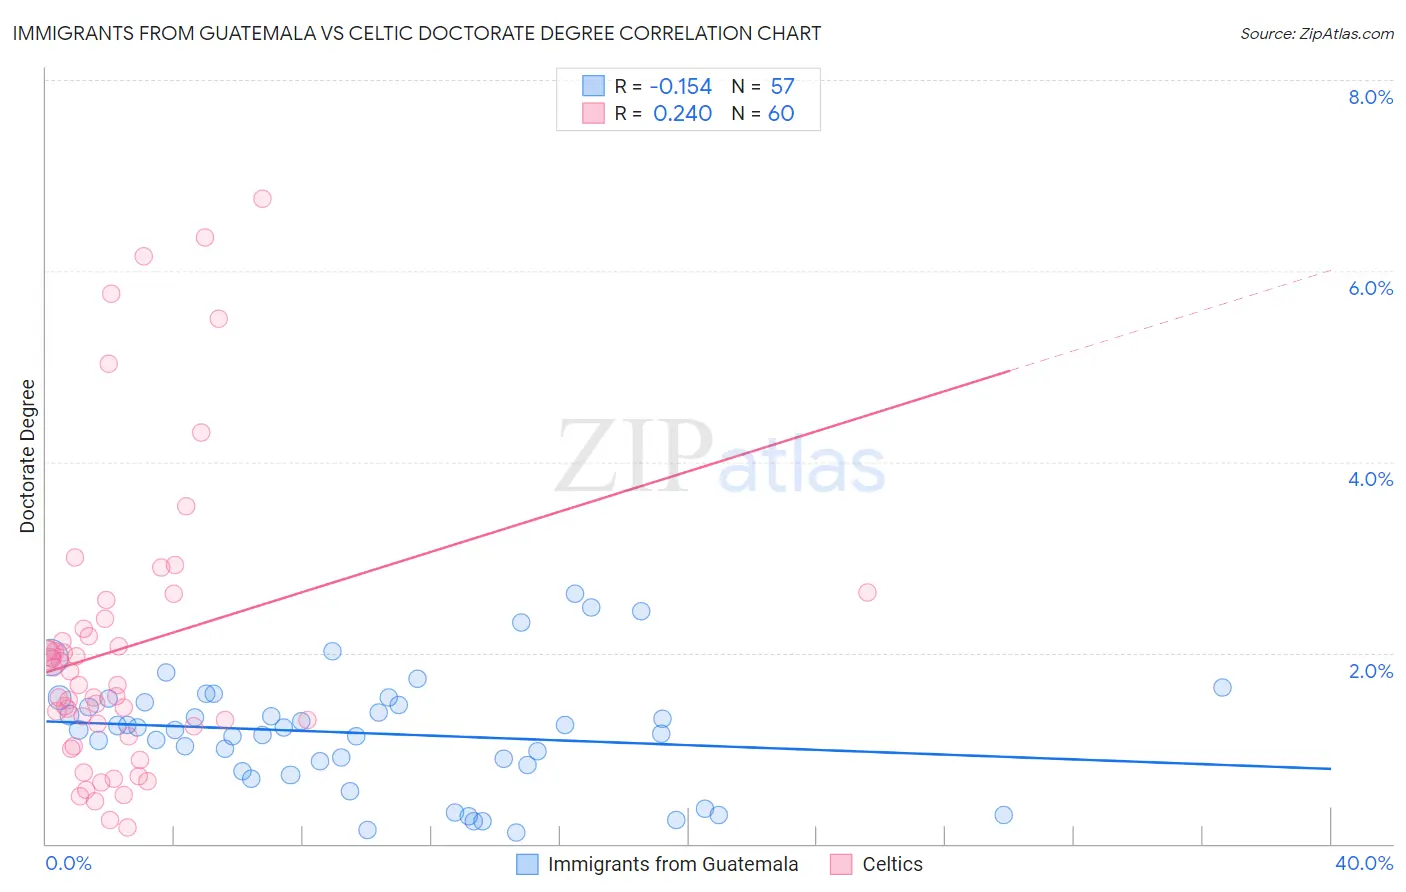
Immigrants from Guatemala vs Celtic Doctorate Degree Correlation Chart
The statistical analysis conducted on geographies consisting of 372,323,954 people shows a poor negative correlation between the proportion of Immigrants from Guatemala and percentage of population with at least doctorate degree education in the United States with a correlation coefficient (R) of -0.154 and weighted average of 1.4%. Similarly, the statistical analysis conducted on geographies consisting of 167,913,023 people shows a weak positive correlation between the proportion of Celtics and percentage of population with at least doctorate degree education in the United States with a correlation coefficient (R) of 0.240 and weighted average of 1.9%, a difference of 35.7%.
Doctorate Degree Correlation Summary
| Measurement | Immigrants from Guatemala | Celtic |
| Minimum | 0.11% | 0.17% |
| Maximum | 2.6% | 6.8% |
| Range | 2.5% | 6.6% |
| Mean | 1.2% | 2.1% |
| Median | 1.2% | 1.7% |
| Interquartile 25% (IQ1) | 0.80% | 1.2% |
| Interquartile 75% (IQ3) | 1.5% | 2.3% |
| Interquartile Range (IQR) | 0.70% | 1.1% |
| Standard Deviation (Sample) | 0.60% | 1.5% |
| Standard Deviation (Population) | 0.59% | 1.5% |
Similar Demographics by Doctorate Degree
Demographics Similar to Immigrants from Guatemala by Doctorate Degree
In terms of doctorate degree, the demographic groups most similar to Immigrants from Guatemala are Honduran (1.4%, a difference of 0.070%), Belizean (1.4%, a difference of 0.33%), Shoshone (1.4%, a difference of 0.40%), Immigrants from Dominica (1.4%, a difference of 0.42%), and Mexican American Indian (1.4%, a difference of 0.48%).
| Demographics | Rating | Rank | Doctorate Degree |
| Immigrants | Yemen | 0.2 /100 | #293 | Tragic 1.4% |
| Samoans | 0.2 /100 | #294 | Tragic 1.4% |
| Guatemalans | 0.2 /100 | #295 | Tragic 1.4% |
| Immigrants | Ecuador | 0.2 /100 | #296 | Tragic 1.4% |
| Tsimshian | 0.2 /100 | #297 | Tragic 1.4% |
| Puerto Ricans | 0.1 /100 | #298 | Tragic 1.4% |
| Belizeans | 0.1 /100 | #299 | Tragic 1.4% |
| Immigrants | Guatemala | 0.1 /100 | #300 | Tragic 1.4% |
| Hondurans | 0.1 /100 | #301 | Tragic 1.4% |
| Shoshone | 0.1 /100 | #302 | Tragic 1.4% |
| Immigrants | Dominica | 0.1 /100 | #303 | Tragic 1.4% |
| Mexican American Indians | 0.1 /100 | #304 | Tragic 1.4% |
| Pennsylvania Germans | 0.1 /100 | #305 | Tragic 1.4% |
| Guyanese | 0.1 /100 | #306 | Tragic 1.4% |
| Cubans | 0.1 /100 | #307 | Tragic 1.4% |
Demographics Similar to Celtics by Doctorate Degree
In terms of doctorate degree, the demographic groups most similar to Celtics are Czech (1.9%, a difference of 0.10%), Irish (1.9%, a difference of 0.13%), Immigrants from Middle Africa (1.9%, a difference of 0.35%), Scotch-Irish (1.9%, a difference of 0.49%), and Welsh (1.9%, a difference of 0.50%).
| Demographics | Rating | Rank | Doctorate Degree |
| Danes | 71.9 /100 | #157 | Good 1.9% |
| Hungarians | 71.7 /100 | #158 | Good 1.9% |
| Slovenes | 70.2 /100 | #159 | Good 1.9% |
| Welsh | 69.7 /100 | #160 | Good 1.9% |
| Immigrants | Middle Africa | 68.8 /100 | #161 | Good 1.9% |
| Irish | 67.5 /100 | #162 | Good 1.9% |
| Czechs | 67.3 /100 | #163 | Good 1.9% |
| Celtics | 66.7 /100 | #164 | Good 1.9% |
| Scotch-Irish | 63.6 /100 | #165 | Good 1.9% |
| Spaniards | 63.5 /100 | #166 | Good 1.9% |
| Macedonians | 60.9 /100 | #167 | Good 1.9% |
| Sri Lankans | 60.3 /100 | #168 | Good 1.9% |
| Vietnamese | 54.8 /100 | #169 | Average 1.9% |
| Costa Ricans | 53.3 /100 | #170 | Average 1.8% |
| Bermudans | 52.1 /100 | #171 | Average 1.8% |