Immigrants from Hong Kong vs Sudanese College, Under 1 year
COMPARE
Immigrants from Hong Kong
Sudanese
College, Under 1 year
College, Under 1 year Comparison
Immigrants from Hong Kong
Sudanese
71.0%
COLLEGE, UNDER 1 YEAR
100.0/ 100
METRIC RATING
28th/ 347
METRIC RANK
66.2%
COLLEGE, UNDER 1 YEAR
74.1/ 100
METRIC RATING
152nd/ 347
METRIC RANK
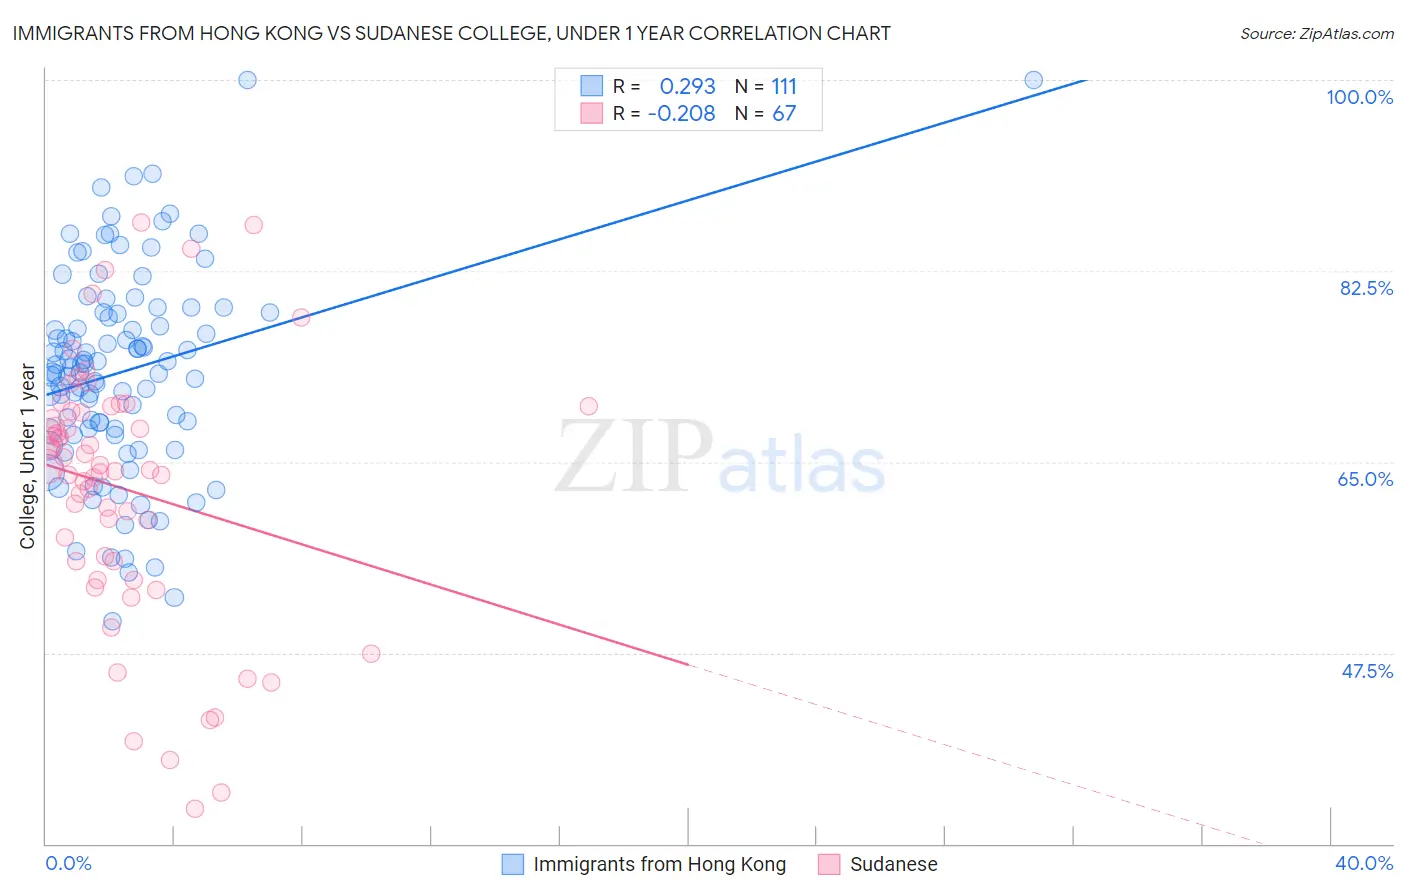
Immigrants from Hong Kong vs Sudanese College, Under 1 year Correlation Chart
The statistical analysis conducted on geographies consisting of 253,990,081 people shows a weak positive correlation between the proportion of Immigrants from Hong Kong and percentage of population with at least college, under 1 year education in the United States with a correlation coefficient (R) of 0.293 and weighted average of 71.0%. Similarly, the statistical analysis conducted on geographies consisting of 110,147,273 people shows a weak negative correlation between the proportion of Sudanese and percentage of population with at least college, under 1 year education in the United States with a correlation coefficient (R) of -0.208 and weighted average of 66.2%, a difference of 7.3%.
College, Under 1 year Correlation Summary
| Measurement | Immigrants from Hong Kong | Sudanese |
| Minimum | 50.4% | 33.2% |
| Maximum | 100.0% | 86.9% |
| Range | 49.6% | 53.7% |
| Mean | 73.3% | 62.5% |
| Median | 73.6% | 64.3% |
| Interquartile 25% (IQ1) | 67.8% | 55.9% |
| Interquartile 75% (IQ3) | 78.7% | 69.7% |
| Interquartile Range (IQR) | 10.9% | 13.8% |
| Standard Deviation (Sample) | 9.4% | 12.0% |
| Standard Deviation (Population) | 9.4% | 11.9% |
Similar Demographics by College, Under 1 year
Demographics Similar to Immigrants from Hong Kong by College, Under 1 year
In terms of college, under 1 year, the demographic groups most similar to Immigrants from Hong Kong are Immigrants from France (71.0%, a difference of 0.0%), Immigrants from Denmark (71.0%, a difference of 0.030%), Immigrants from Ireland (71.0%, a difference of 0.030%), Bulgarian (71.1%, a difference of 0.15%), and Soviet Union (71.1%, a difference of 0.17%).
| Demographics | Rating | Rank | College, Under 1 year |
| Immigrants | Belgium | 100.0 /100 | #21 | Exceptional 71.5% |
| Immigrants | Eastern Asia | 100.0 /100 | #22 | Exceptional 71.3% |
| Immigrants | Northern Europe | 100.0 /100 | #23 | Exceptional 71.1% |
| Soviet Union | 100.0 /100 | #24 | Exceptional 71.1% |
| Bulgarians | 100.0 /100 | #25 | Exceptional 71.1% |
| Immigrants | Denmark | 100.0 /100 | #26 | Exceptional 71.0% |
| Immigrants | Ireland | 100.0 /100 | #27 | Exceptional 71.0% |
| Immigrants | Hong Kong | 100.0 /100 | #28 | Exceptional 71.0% |
| Immigrants | France | 100.0 /100 | #29 | Exceptional 71.0% |
| Immigrants | China | 99.9 /100 | #30 | Exceptional 70.9% |
| Indians (Asian) | 99.9 /100 | #31 | Exceptional 70.8% |
| Turks | 99.9 /100 | #32 | Exceptional 70.7% |
| Immigrants | South Africa | 99.9 /100 | #33 | Exceptional 70.6% |
| Estonians | 99.9 /100 | #34 | Exceptional 70.6% |
| Russians | 99.9 /100 | #35 | Exceptional 70.5% |
Demographics Similar to Sudanese by College, Under 1 year
In terms of college, under 1 year, the demographic groups most similar to Sudanese are Belgian (66.2%, a difference of 0.020%), Immigrants from Sudan (66.2%, a difference of 0.11%), Immigrants from Eritrea (66.1%, a difference of 0.12%), Immigrants from Iraq (66.3%, a difference of 0.18%), and Irish (66.0%, a difference of 0.21%).
| Demographics | Rating | Rank | College, Under 1 year |
| Immigrants | Kenya | 81.8 /100 | #145 | Excellent 66.5% |
| Kenyans | 81.7 /100 | #146 | Excellent 66.5% |
| Immigrants | Morocco | 81.7 /100 | #147 | Excellent 66.5% |
| Taiwanese | 78.6 /100 | #148 | Good 66.4% |
| Immigrants | Venezuela | 77.9 /100 | #149 | Good 66.3% |
| Immigrants | Iraq | 77.1 /100 | #150 | Good 66.3% |
| Immigrants | Sudan | 76.0 /100 | #151 | Good 66.2% |
| Sudanese | 74.1 /100 | #152 | Good 66.2% |
| Belgians | 73.7 /100 | #153 | Good 66.2% |
| Immigrants | Eritrea | 71.9 /100 | #154 | Good 66.1% |
| Irish | 70.3 /100 | #155 | Good 66.0% |
| Welsh | 69.9 /100 | #156 | Good 66.0% |
| Sierra Leoneans | 67.8 /100 | #157 | Good 66.0% |
| Celtics | 67.3 /100 | #158 | Good 65.9% |
| Tlingit-Haida | 66.4 /100 | #159 | Good 65.9% |