Immigrants from Hong Kong vs South American Unemployment Among Women with Children Under 6 years
COMPARE
Immigrants from Hong Kong
South American
Unemployment Among Women with Children Under 6 years
Unemployment Among Women with Children Under 6 years Comparison
Immigrants from Hong Kong
South Americans
5.8%
UNEMPLOYMENT AMONG WOMEN WITH CHILDREN UNDER 6 YEARS
100.0/ 100
METRIC RATING
2nd/ 347
METRIC RANK
7.5%
UNEMPLOYMENT AMONG WOMEN WITH CHILDREN UNDER 6 YEARS
74.1/ 100
METRIC RATING
155th/ 347
METRIC RANK
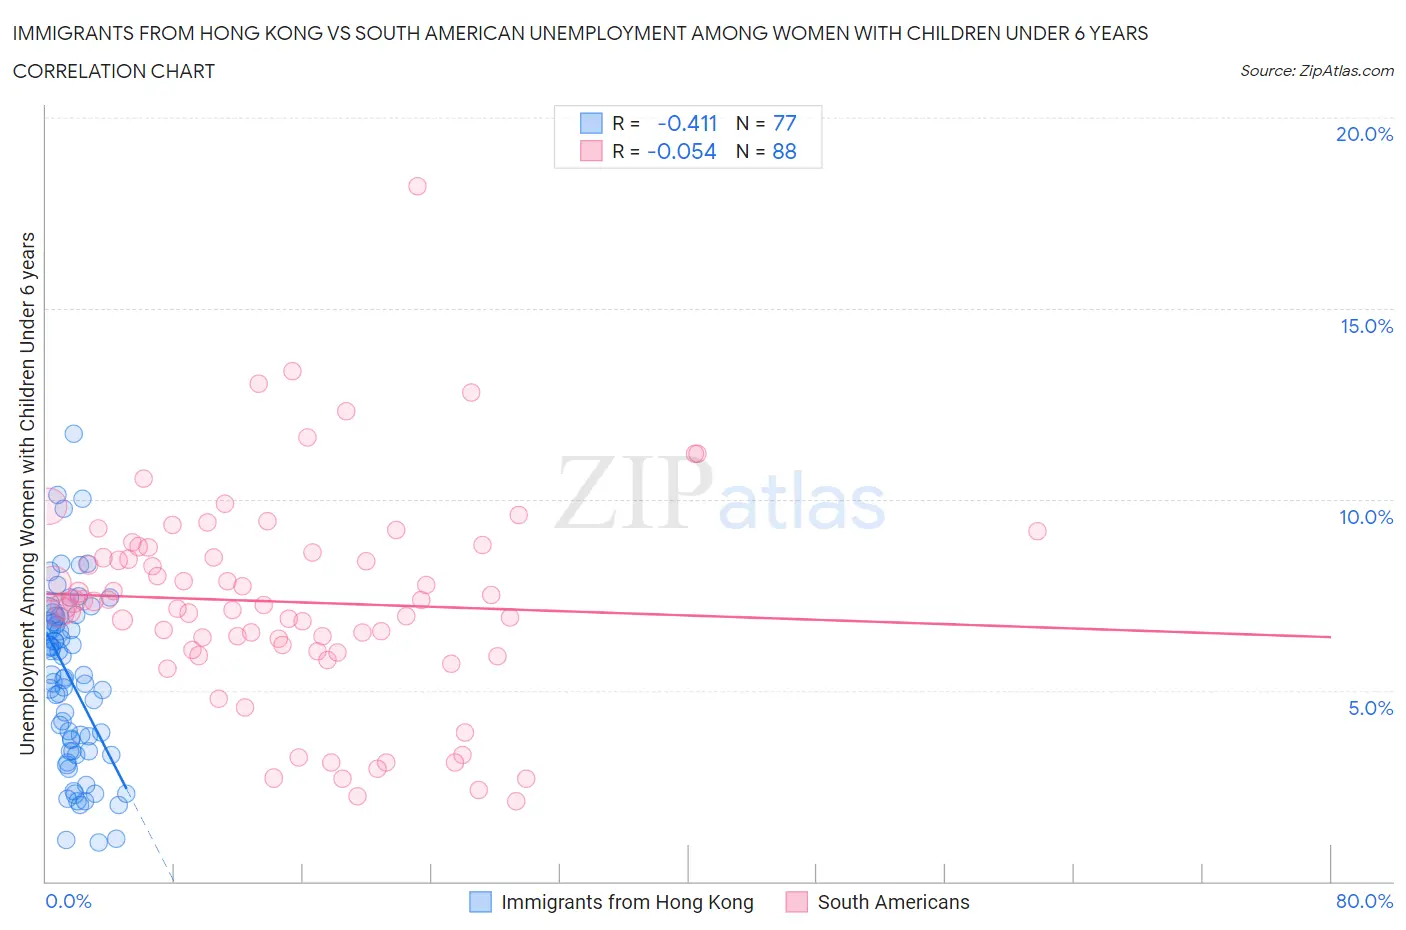
Immigrants from Hong Kong vs South American Unemployment Among Women with Children Under 6 years Correlation Chart
The statistical analysis conducted on geographies consisting of 208,576,237 people shows a moderate negative correlation between the proportion of Immigrants from Hong Kong and unemployment rate among women with children under the age of 6 in the United States with a correlation coefficient (R) of -0.411 and weighted average of 5.8%. Similarly, the statistical analysis conducted on geographies consisting of 355,844,194 people shows a slight negative correlation between the proportion of South Americans and unemployment rate among women with children under the age of 6 in the United States with a correlation coefficient (R) of -0.054 and weighted average of 7.5%, a difference of 29.8%.
Unemployment Among Women with Children Under 6 years Correlation Summary
| Measurement | Immigrants from Hong Kong | South American |
| Minimum | 1.0% | 2.1% |
| Maximum | 11.7% | 18.2% |
| Range | 10.7% | 16.1% |
| Mean | 5.2% | 7.3% |
| Median | 5.3% | 7.3% |
| Interquartile 25% (IQ1) | 3.4% | 6.0% |
| Interquartile 75% (IQ3) | 6.9% | 8.7% |
| Interquartile Range (IQR) | 3.5% | 2.6% |
| Standard Deviation (Sample) | 2.3% | 2.8% |
| Standard Deviation (Population) | 2.3% | 2.7% |
Similar Demographics by Unemployment Among Women with Children Under 6 years
Demographics Similar to Immigrants from Hong Kong by Unemployment Among Women with Children Under 6 years
In terms of unemployment among women with children under 6 years, the demographic groups most similar to Immigrants from Hong Kong are Okinawan (5.8%, a difference of 0.87%), Cambodian (5.9%, a difference of 1.8%), Cape Verdean (5.9%, a difference of 2.8%), Immigrants from Taiwan (6.0%, a difference of 4.5%), and Taiwanese (6.1%, a difference of 5.1%).
| Demographics | Rating | Rank | Unemployment Among Women with Children Under 6 years |
| Immigrants | Cabo Verde | 100.0 /100 | #1 | Exceptional 5.4% |
| Immigrants | Hong Kong | 100.0 /100 | #2 | Exceptional 5.8% |
| Okinawans | 100.0 /100 | #3 | Exceptional 5.8% |
| Cambodians | 100.0 /100 | #4 | Exceptional 5.9% |
| Cape Verdeans | 100.0 /100 | #5 | Exceptional 5.9% |
| Immigrants | Taiwan | 100.0 /100 | #6 | Exceptional 6.0% |
| Taiwanese | 100.0 /100 | #7 | Exceptional 6.1% |
| Immigrants | India | 100.0 /100 | #8 | Exceptional 6.1% |
| Filipinos | 100.0 /100 | #9 | Exceptional 6.1% |
| Immigrants | China | 100.0 /100 | #10 | Exceptional 6.2% |
| Indians (Asian) | 100.0 /100 | #11 | Exceptional 6.3% |
| Immigrants | Singapore | 100.0 /100 | #12 | Exceptional 6.3% |
| Immigrants | Eastern Asia | 100.0 /100 | #13 | Exceptional 6.3% |
| Immigrants | Bulgaria | 100.0 /100 | #14 | Exceptional 6.3% |
| Thais | 100.0 /100 | #15 | Exceptional 6.3% |
Demographics Similar to South Americans by Unemployment Among Women with Children Under 6 years
In terms of unemployment among women with children under 6 years, the demographic groups most similar to South Americans are Northern European (7.5%, a difference of 0.020%), Uruguayan (7.5%, a difference of 0.050%), Bangladeshi (7.5%, a difference of 0.060%), Immigrants from Peru (7.5%, a difference of 0.070%), and Immigrants from Southern Europe (7.5%, a difference of 0.080%).
| Demographics | Rating | Rank | Unemployment Among Women with Children Under 6 years |
| Immigrants | Brazil | 77.3 /100 | #148 | Good 7.5% |
| Colombians | 76.1 /100 | #149 | Good 7.5% |
| Aleuts | 76.0 /100 | #150 | Good 7.5% |
| Immigrants | Peru | 74.9 /100 | #151 | Good 7.5% |
| Bangladeshis | 74.8 /100 | #152 | Good 7.5% |
| Uruguayans | 74.7 /100 | #153 | Good 7.5% |
| Northern Europeans | 74.3 /100 | #154 | Good 7.5% |
| South Americans | 74.1 /100 | #155 | Good 7.5% |
| Immigrants | Southern Europe | 73.2 /100 | #156 | Good 7.5% |
| Peruvians | 72.3 /100 | #157 | Good 7.5% |
| Croatians | 71.9 /100 | #158 | Good 7.5% |
| Immigrants | Philippines | 71.3 /100 | #159 | Good 7.5% |
| Bolivians | 70.8 /100 | #160 | Good 7.5% |
| Immigrants | Western Asia | 70.2 /100 | #161 | Good 7.5% |
| Immigrants | Lithuania | 68.8 /100 | #162 | Good 7.5% |