Immigrants from Hong Kong vs Immigrants from Czechoslovakia College, Under 1 year
COMPARE
Immigrants from Hong Kong
Immigrants from Czechoslovakia
College, Under 1 year
College, Under 1 year Comparison
Immigrants from Hong Kong
Immigrants from Czechoslovakia
71.0%
COLLEGE, UNDER 1 YEAR
100.0/ 100
METRIC RATING
28th/ 347
METRIC RANK
69.6%
COLLEGE, UNDER 1 YEAR
99.7/ 100
METRIC RATING
54th/ 347
METRIC RANK
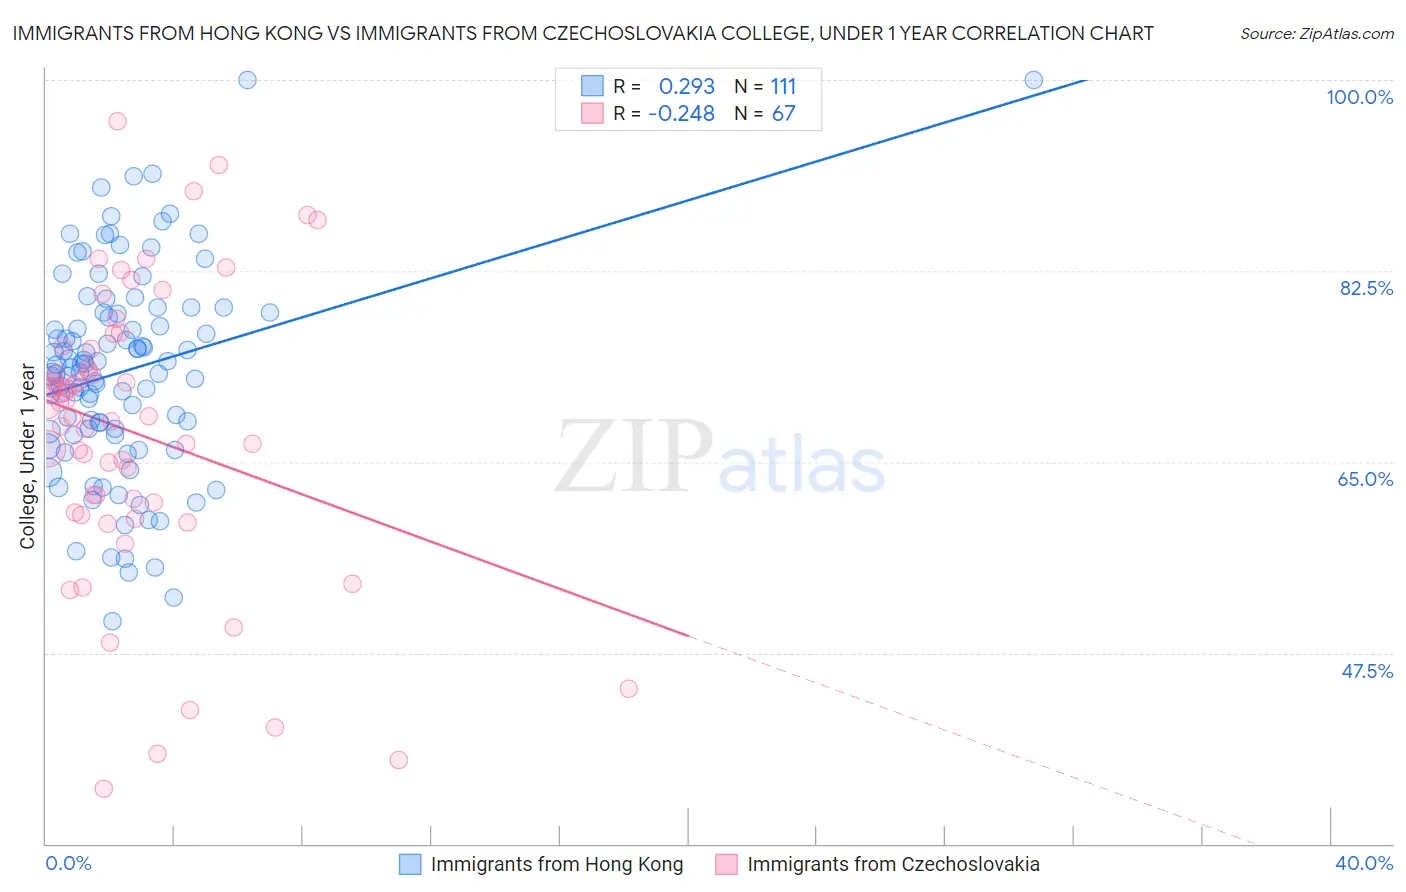
Immigrants from Hong Kong vs Immigrants from Czechoslovakia College, Under 1 year Correlation Chart
The statistical analysis conducted on geographies consisting of 253,990,081 people shows a weak positive correlation between the proportion of Immigrants from Hong Kong and percentage of population with at least college, under 1 year education in the United States with a correlation coefficient (R) of 0.293 and weighted average of 71.0%. Similarly, the statistical analysis conducted on geographies consisting of 195,448,477 people shows a weak negative correlation between the proportion of Immigrants from Czechoslovakia and percentage of population with at least college, under 1 year education in the United States with a correlation coefficient (R) of -0.248 and weighted average of 69.6%, a difference of 2.0%.
College, Under 1 year Correlation Summary
| Measurement | Immigrants from Hong Kong | Immigrants from Czechoslovakia |
| Minimum | 50.4% | 35.1% |
| Maximum | 100.0% | 96.2% |
| Range | 49.6% | 61.1% |
| Mean | 73.3% | 67.6% |
| Median | 73.6% | 69.2% |
| Interquartile 25% (IQ1) | 67.8% | 60.4% |
| Interquartile 75% (IQ3) | 78.7% | 75.3% |
| Interquartile Range (IQR) | 10.9% | 14.9% |
| Standard Deviation (Sample) | 9.4% | 13.2% |
| Standard Deviation (Population) | 9.4% | 13.1% |
Similar Demographics by College, Under 1 year
Demographics Similar to Immigrants from Hong Kong by College, Under 1 year
In terms of college, under 1 year, the demographic groups most similar to Immigrants from Hong Kong are Immigrants from France (71.0%, a difference of 0.0%), Immigrants from Denmark (71.0%, a difference of 0.030%), Immigrants from Ireland (71.0%, a difference of 0.030%), Bulgarian (71.1%, a difference of 0.15%), and Soviet Union (71.1%, a difference of 0.17%).
| Demographics | Rating | Rank | College, Under 1 year |
| Immigrants | Belgium | 100.0 /100 | #21 | Exceptional 71.5% |
| Immigrants | Eastern Asia | 100.0 /100 | #22 | Exceptional 71.3% |
| Immigrants | Northern Europe | 100.0 /100 | #23 | Exceptional 71.1% |
| Soviet Union | 100.0 /100 | #24 | Exceptional 71.1% |
| Bulgarians | 100.0 /100 | #25 | Exceptional 71.1% |
| Immigrants | Denmark | 100.0 /100 | #26 | Exceptional 71.0% |
| Immigrants | Ireland | 100.0 /100 | #27 | Exceptional 71.0% |
| Immigrants | Hong Kong | 100.0 /100 | #28 | Exceptional 71.0% |
| Immigrants | France | 100.0 /100 | #29 | Exceptional 71.0% |
| Immigrants | China | 99.9 /100 | #30 | Exceptional 70.9% |
| Indians (Asian) | 99.9 /100 | #31 | Exceptional 70.8% |
| Turks | 99.9 /100 | #32 | Exceptional 70.7% |
| Immigrants | South Africa | 99.9 /100 | #33 | Exceptional 70.6% |
| Estonians | 99.9 /100 | #34 | Exceptional 70.6% |
| Russians | 99.9 /100 | #35 | Exceptional 70.5% |
Demographics Similar to Immigrants from Czechoslovakia by College, Under 1 year
In terms of college, under 1 year, the demographic groups most similar to Immigrants from Czechoslovakia are Maltese (69.5%, a difference of 0.10%), South African (69.7%, a difference of 0.12%), Immigrants from Scotland (69.4%, a difference of 0.22%), Asian (69.4%, a difference of 0.25%), and Immigrants from Malaysia (69.3%, a difference of 0.34%).
| Demographics | Rating | Rank | College, Under 1 year |
| Immigrants | Bulgaria | 99.8 /100 | #47 | Exceptional 70.0% |
| Immigrants | Netherlands | 99.8 /100 | #48 | Exceptional 70.0% |
| Immigrants | Austria | 99.8 /100 | #49 | Exceptional 70.0% |
| Zimbabweans | 99.8 /100 | #50 | Exceptional 69.9% |
| Mongolians | 99.8 /100 | #51 | Exceptional 69.9% |
| Immigrants | Russia | 99.8 /100 | #52 | Exceptional 69.9% |
| South Africans | 99.7 /100 | #53 | Exceptional 69.7% |
| Immigrants | Czechoslovakia | 99.7 /100 | #54 | Exceptional 69.6% |
| Maltese | 99.7 /100 | #55 | Exceptional 69.5% |
| Immigrants | Scotland | 99.6 /100 | #56 | Exceptional 69.4% |
| Asians | 99.6 /100 | #57 | Exceptional 69.4% |
| Immigrants | Malaysia | 99.6 /100 | #58 | Exceptional 69.3% |
| Immigrants | Serbia | 99.5 /100 | #59 | Exceptional 69.3% |
| Immigrants | Asia | 99.5 /100 | #60 | Exceptional 69.2% |
| Immigrants | Kazakhstan | 99.5 /100 | #61 | Exceptional 69.2% |