Immigrants from Guyana vs Osage College, 1 year or more
COMPARE
Immigrants from Guyana
Osage
College, 1 year or more
College, 1 year or more Comparison
Immigrants from Guyana
Osage
53.5%
COLLEGE, 1 YEAR OR MORE
0.1/ 100
METRIC RATING
285th/ 347
METRIC RANK
55.8%
COLLEGE, 1 YEAR OR MORE
1.0/ 100
METRIC RATING
243rd/ 347
METRIC RANK
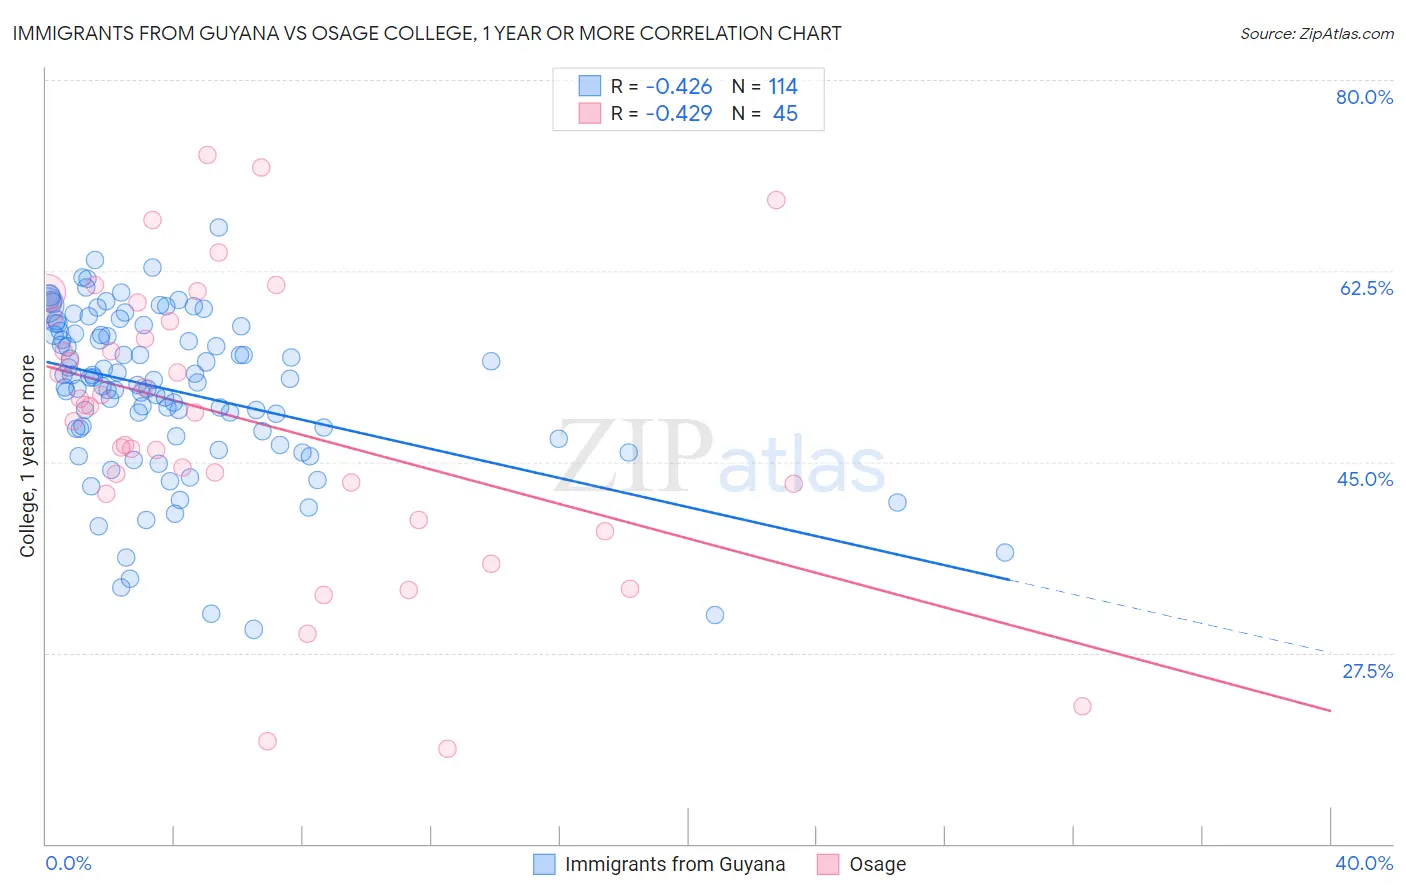
Immigrants from Guyana vs Osage College, 1 year or more Correlation Chart
The statistical analysis conducted on geographies consisting of 183,735,121 people shows a moderate negative correlation between the proportion of Immigrants from Guyana and percentage of population with at least college, 1 year or more education in the United States with a correlation coefficient (R) of -0.426 and weighted average of 53.5%. Similarly, the statistical analysis conducted on geographies consisting of 91,808,929 people shows a moderate negative correlation between the proportion of Osage and percentage of population with at least college, 1 year or more education in the United States with a correlation coefficient (R) of -0.429 and weighted average of 55.8%, a difference of 4.1%.
College, 1 year or more Correlation Summary
| Measurement | Immigrants from Guyana | Osage |
| Minimum | 29.6% | 18.8% |
| Maximum | 66.5% | 73.1% |
| Range | 36.8% | 54.3% |
| Mean | 51.5% | 48.7% |
| Median | 52.6% | 50.1% |
| Interquartile 25% (IQ1) | 47.8% | 42.6% |
| Interquartile 75% (IQ3) | 57.0% | 58.1% |
| Interquartile Range (IQR) | 9.2% | 15.5% |
| Standard Deviation (Sample) | 7.4% | 12.9% |
| Standard Deviation (Population) | 7.4% | 12.8% |
Similar Demographics by College, 1 year or more
Demographics Similar to Immigrants from Guyana by College, 1 year or more
In terms of college, 1 year or more, the demographic groups most similar to Immigrants from Guyana are Central American Indian (53.5%, a difference of 0.040%), Immigrants from Belize (53.5%, a difference of 0.080%), Alaska Native (53.4%, a difference of 0.25%), Immigrants from Ecuador (53.4%, a difference of 0.25%), and Alaskan Athabascan (53.4%, a difference of 0.27%).
| Demographics | Rating | Rank | College, 1 year or more |
| Immigrants | Jamaica | 0.1 /100 | #278 | Tragic 54.2% |
| Arapaho | 0.1 /100 | #279 | Tragic 54.1% |
| Cheyenne | 0.1 /100 | #280 | Tragic 54.1% |
| Colville | 0.1 /100 | #281 | Tragic 54.1% |
| Guyanese | 0.1 /100 | #282 | Tragic 54.1% |
| Nicaraguans | 0.1 /100 | #283 | Tragic 53.9% |
| Ute | 0.1 /100 | #284 | Tragic 53.8% |
| Immigrants | Guyana | 0.1 /100 | #285 | Tragic 53.5% |
| Central American Indians | 0.1 /100 | #286 | Tragic 53.5% |
| Immigrants | Belize | 0.1 /100 | #287 | Tragic 53.5% |
| Alaska Natives | 0.0 /100 | #288 | Tragic 53.4% |
| Immigrants | Ecuador | 0.0 /100 | #289 | Tragic 53.4% |
| Alaskan Athabascans | 0.0 /100 | #290 | Tragic 53.4% |
| Cubans | 0.0 /100 | #291 | Tragic 53.4% |
| Chickasaw | 0.0 /100 | #292 | Tragic 53.3% |
Demographics Similar to Osage by College, 1 year or more
In terms of college, 1 year or more, the demographic groups most similar to Osage are Marshallese (55.8%, a difference of 0.010%), French American Indian (55.8%, a difference of 0.12%), Chippewa (55.7%, a difference of 0.12%), Trinidadian and Tobagonian (55.8%, a difference of 0.16%), and Immigrants from Liberia (55.7%, a difference of 0.19%).
| Demographics | Rating | Rank | College, 1 year or more |
| Iroquois | 1.7 /100 | #236 | Tragic 56.2% |
| Samoans | 1.6 /100 | #237 | Tragic 56.2% |
| Barbadians | 1.3 /100 | #238 | Tragic 56.0% |
| Puget Sound Salish | 1.1 /100 | #239 | Tragic 55.9% |
| Trinidadians and Tobagonians | 1.1 /100 | #240 | Tragic 55.8% |
| French American Indians | 1.0 /100 | #241 | Tragic 55.8% |
| Marshallese | 1.0 /100 | #242 | Tragic 55.8% |
| Osage | 1.0 /100 | #243 | Tragic 55.8% |
| Chippewa | 0.9 /100 | #244 | Tragic 55.7% |
| Immigrants | Liberia | 0.8 /100 | #245 | Tragic 55.7% |
| Malaysians | 0.8 /100 | #246 | Tragic 55.6% |
| Hawaiians | 0.8 /100 | #247 | Tragic 55.6% |
| Immigrants | Congo | 0.8 /100 | #248 | Tragic 55.6% |
| Immigrants | Trinidad and Tobago | 0.7 /100 | #249 | Tragic 55.5% |
| Delaware | 0.7 /100 | #250 | Tragic 55.5% |