Immigrants from Singapore vs Alaska Native Master's Degree
COMPARE
Immigrants from Singapore
Alaska Native
Master's Degree
Master's Degree Comparison
Immigrants from Singapore
Alaska Natives
23.4%
MASTER'S DEGREE
100.0/ 100
METRIC RATING
1st/ 347
METRIC RANK
11.6%
MASTER'S DEGREE
0.1/ 100
METRIC RATING
293rd/ 347
METRIC RANK
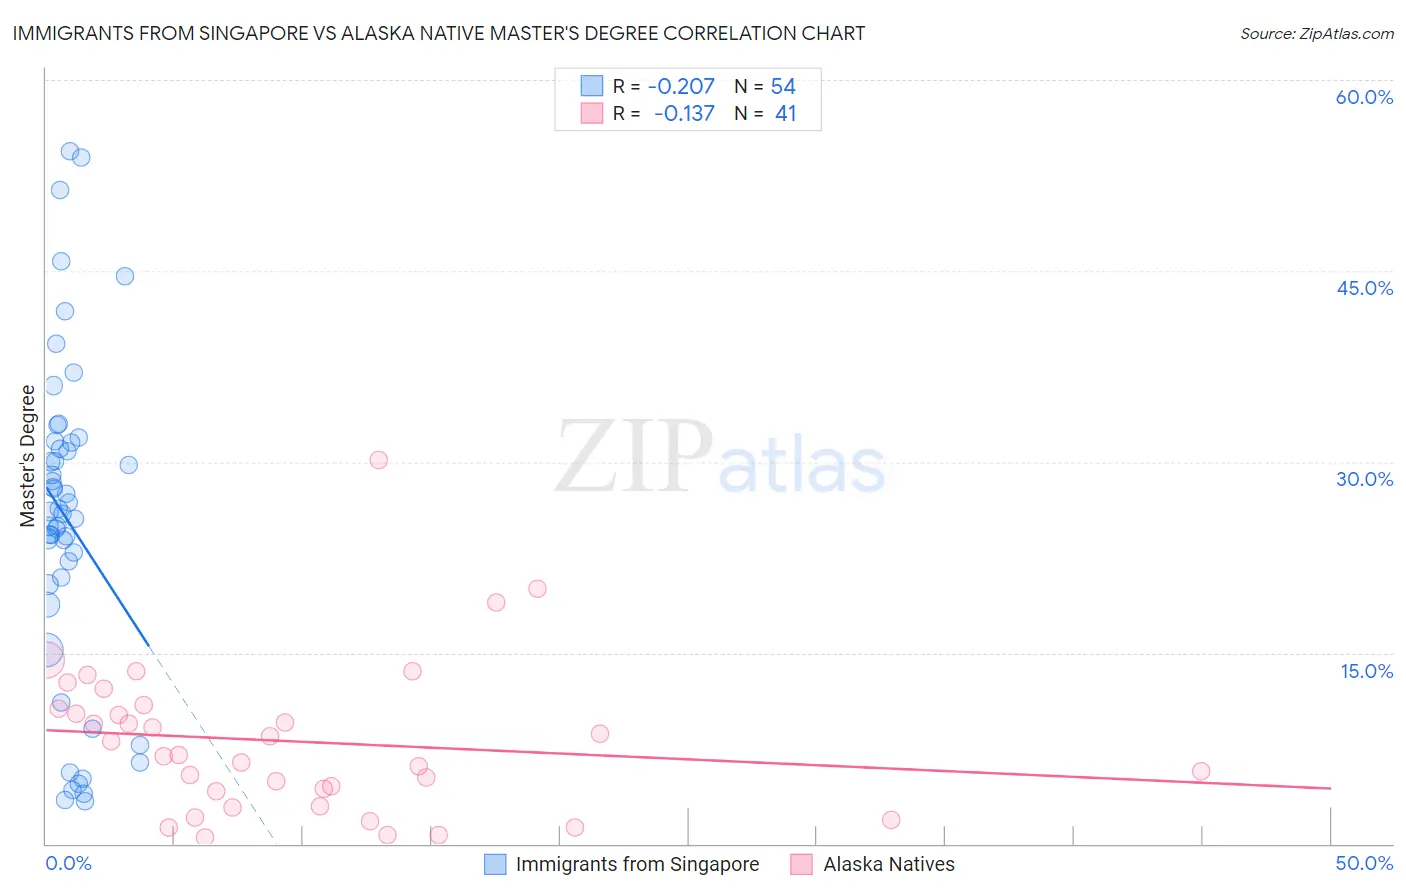
Immigrants from Singapore vs Alaska Native Master's Degree Correlation Chart
The statistical analysis conducted on geographies consisting of 137,491,179 people shows a weak negative correlation between the proportion of Immigrants from Singapore and percentage of population with at least master's degree education in the United States with a correlation coefficient (R) of -0.207 and weighted average of 23.4%. Similarly, the statistical analysis conducted on geographies consisting of 76,746,522 people shows a poor negative correlation between the proportion of Alaska Natives and percentage of population with at least master's degree education in the United States with a correlation coefficient (R) of -0.137 and weighted average of 11.6%, a difference of 101.9%.
Master's Degree Correlation Summary
| Measurement | Immigrants from Singapore | Alaska Native |
| Minimum | 3.3% | 0.50% |
| Maximum | 54.4% | 30.1% |
| Range | 51.1% | 29.6% |
| Mean | 25.3% | 8.0% |
| Median | 26.0% | 7.0% |
| Interquartile 25% (IQ1) | 20.4% | 3.5% |
| Interquartile 75% (IQ3) | 31.5% | 10.8% |
| Interquartile Range (IQR) | 11.2% | 7.2% |
| Standard Deviation (Sample) | 12.8% | 6.0% |
| Standard Deviation (Population) | 12.7% | 5.9% |
Similar Demographics by Master's Degree
Demographics Similar to Immigrants from Singapore by Master's Degree
In terms of master's degree, the demographic groups most similar to Immigrants from Singapore are Filipino (23.4%, a difference of 0.050%), Immigrants from Israel (22.6%, a difference of 3.4%), Okinawan (22.6%, a difference of 3.4%), Immigrants from Taiwan (22.5%, a difference of 4.3%), and Immigrants from India (22.3%, a difference of 5.0%).
| Demographics | Rating | Rank | Master's Degree |
| Immigrants | Singapore | 100.0 /100 | #1 | Exceptional 23.4% |
| Filipinos | 100.0 /100 | #2 | Exceptional 23.4% |
| Immigrants | Israel | 100.0 /100 | #3 | Exceptional 22.6% |
| Okinawans | 100.0 /100 | #4 | Exceptional 22.6% |
| Immigrants | Taiwan | 100.0 /100 | #5 | Exceptional 22.5% |
| Immigrants | India | 100.0 /100 | #6 | Exceptional 22.3% |
| Iranians | 100.0 /100 | #7 | Exceptional 22.3% |
| Cypriots | 100.0 /100 | #8 | Exceptional 21.8% |
| Thais | 100.0 /100 | #9 | Exceptional 21.7% |
| Immigrants | Iran | 100.0 /100 | #10 | Exceptional 21.6% |
| Immigrants | China | 100.0 /100 | #11 | Exceptional 21.2% |
| Eastern Europeans | 100.0 /100 | #12 | Exceptional 21.1% |
| Immigrants | Australia | 100.0 /100 | #13 | Exceptional 20.9% |
| Immigrants | Switzerland | 100.0 /100 | #14 | Exceptional 20.9% |
| Immigrants | Eastern Asia | 100.0 /100 | #15 | Exceptional 20.8% |
Demographics Similar to Alaska Natives by Master's Degree
In terms of master's degree, the demographic groups most similar to Alaska Natives are Hawaiian (11.6%, a difference of 0.10%), Immigrants from Guatemala (11.6%, a difference of 0.23%), Marshallese (11.6%, a difference of 0.25%), Alaskan Athabascan (11.6%, a difference of 0.26%), and Colville (11.6%, a difference of 0.35%).
| Demographics | Rating | Rank | Master's Degree |
| Aleuts | 0.1 /100 | #286 | Tragic 11.8% |
| Immigrants | Haiti | 0.1 /100 | #287 | Tragic 11.8% |
| Immigrants | Honduras | 0.1 /100 | #288 | Tragic 11.8% |
| Guatemalans | 0.1 /100 | #289 | Tragic 11.7% |
| Ute | 0.1 /100 | #290 | Tragic 11.7% |
| Colville | 0.1 /100 | #291 | Tragic 11.6% |
| Immigrants | Guatemala | 0.1 /100 | #292 | Tragic 11.6% |
| Alaska Natives | 0.1 /100 | #293 | Tragic 11.6% |
| Hawaiians | 0.1 /100 | #294 | Tragic 11.6% |
| Marshallese | 0.1 /100 | #295 | Tragic 11.6% |
| Alaskan Athabascans | 0.1 /100 | #296 | Tragic 11.6% |
| Immigrants | Yemen | 0.1 /100 | #297 | Tragic 11.6% |
| Samoans | 0.1 /100 | #298 | Tragic 11.5% |
| Chickasaw | 0.1 /100 | #299 | Tragic 11.4% |
| Chippewa | 0.1 /100 | #300 | Tragic 11.4% |