Immigrants from Somalia vs Alaska Native Master's Degree
COMPARE
Immigrants from Somalia
Alaska Native
Master's Degree
Master's Degree Comparison
Immigrants from Somalia
Alaska Natives
14.1%
MASTER'S DEGREE
15.8/ 100
METRIC RATING
216th/ 347
METRIC RANK
11.6%
MASTER'S DEGREE
0.1/ 100
METRIC RATING
293rd/ 347
METRIC RANK
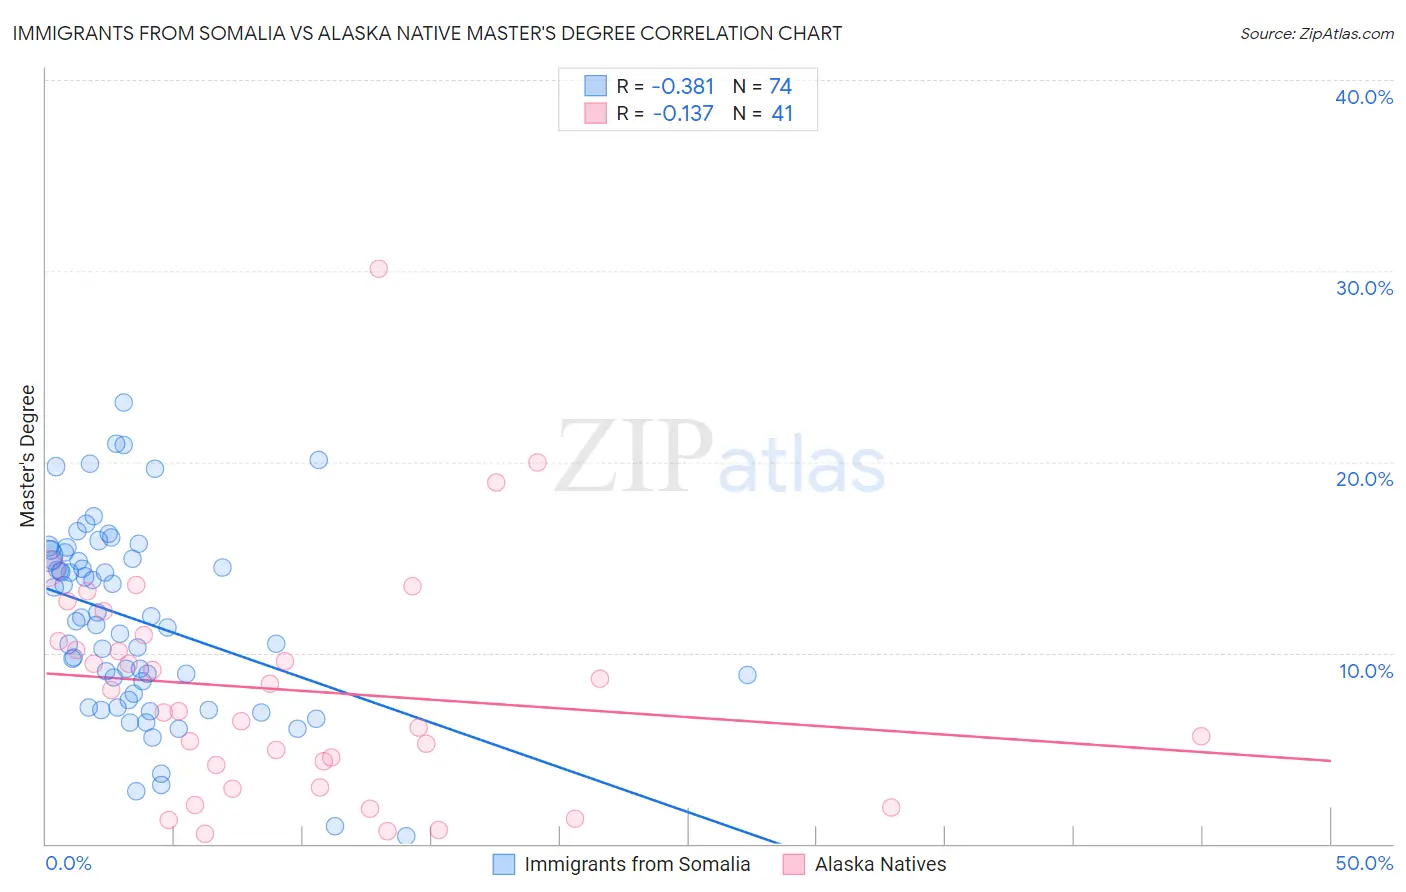
Immigrants from Somalia vs Alaska Native Master's Degree Correlation Chart
The statistical analysis conducted on geographies consisting of 92,109,960 people shows a mild negative correlation between the proportion of Immigrants from Somalia and percentage of population with at least master's degree education in the United States with a correlation coefficient (R) of -0.381 and weighted average of 14.1%. Similarly, the statistical analysis conducted on geographies consisting of 76,746,522 people shows a poor negative correlation between the proportion of Alaska Natives and percentage of population with at least master's degree education in the United States with a correlation coefficient (R) of -0.137 and weighted average of 11.6%, a difference of 21.7%.
Master's Degree Correlation Summary
| Measurement | Immigrants from Somalia | Alaska Native |
| Minimum | 0.40% | 0.50% |
| Maximum | 23.1% | 30.1% |
| Range | 22.7% | 29.6% |
| Mean | 11.7% | 8.0% |
| Median | 11.7% | 7.0% |
| Interquartile 25% (IQ1) | 7.9% | 3.5% |
| Interquartile 75% (IQ3) | 15.1% | 10.8% |
| Interquartile Range (IQR) | 7.2% | 7.2% |
| Standard Deviation (Sample) | 4.9% | 6.0% |
| Standard Deviation (Population) | 4.9% | 5.9% |
Similar Demographics by Master's Degree
Demographics Similar to Immigrants from Somalia by Master's Degree
In terms of master's degree, the demographic groups most similar to Immigrants from Somalia are Immigrants from Trinidad and Tobago (14.1%, a difference of 0.0%), Immigrants from Vietnam (14.1%, a difference of 0.070%), French Canadian (14.1%, a difference of 0.25%), Finnish (14.2%, a difference of 0.27%), and Immigrants from Thailand (14.2%, a difference of 0.29%).
| Demographics | Rating | Rank | Master's Degree |
| Immigrants | Panama | 20.0 /100 | #209 | Fair 14.3% |
| Sub-Saharan Africans | 19.4 /100 | #210 | Poor 14.2% |
| Somalis | 18.0 /100 | #211 | Poor 14.2% |
| Spanish | 17.8 /100 | #212 | Poor 14.2% |
| Immigrants | Thailand | 17.0 /100 | #213 | Poor 14.2% |
| Finns | 16.9 /100 | #214 | Poor 14.2% |
| Immigrants | Vietnam | 16.1 /100 | #215 | Poor 14.1% |
| Immigrants | Somalia | 15.8 /100 | #216 | Poor 14.1% |
| Immigrants | Trinidad and Tobago | 15.8 /100 | #217 | Poor 14.1% |
| French Canadians | 14.9 /100 | #218 | Poor 14.1% |
| Norwegians | 13.6 /100 | #219 | Poor 14.0% |
| Germans | 13.1 /100 | #220 | Poor 14.0% |
| Koreans | 12.7 /100 | #221 | Poor 14.0% |
| Ecuadorians | 12.6 /100 | #222 | Poor 14.0% |
| Immigrants | South Eastern Asia | 11.9 /100 | #223 | Poor 14.0% |
Demographics Similar to Alaska Natives by Master's Degree
In terms of master's degree, the demographic groups most similar to Alaska Natives are Hawaiian (11.6%, a difference of 0.10%), Immigrants from Guatemala (11.6%, a difference of 0.23%), Marshallese (11.6%, a difference of 0.25%), Alaskan Athabascan (11.6%, a difference of 0.26%), and Colville (11.6%, a difference of 0.35%).
| Demographics | Rating | Rank | Master's Degree |
| Aleuts | 0.1 /100 | #286 | Tragic 11.8% |
| Immigrants | Haiti | 0.1 /100 | #287 | Tragic 11.8% |
| Immigrants | Honduras | 0.1 /100 | #288 | Tragic 11.8% |
| Guatemalans | 0.1 /100 | #289 | Tragic 11.7% |
| Ute | 0.1 /100 | #290 | Tragic 11.7% |
| Colville | 0.1 /100 | #291 | Tragic 11.6% |
| Immigrants | Guatemala | 0.1 /100 | #292 | Tragic 11.6% |
| Alaska Natives | 0.1 /100 | #293 | Tragic 11.6% |
| Hawaiians | 0.1 /100 | #294 | Tragic 11.6% |
| Marshallese | 0.1 /100 | #295 | Tragic 11.6% |
| Alaskan Athabascans | 0.1 /100 | #296 | Tragic 11.6% |
| Immigrants | Yemen | 0.1 /100 | #297 | Tragic 11.6% |
| Samoans | 0.1 /100 | #298 | Tragic 11.5% |
| Chickasaw | 0.1 /100 | #299 | Tragic 11.4% |
| Chippewa | 0.1 /100 | #300 | Tragic 11.4% |