New Zealander vs Alaska Native Master's Degree
COMPARE
New Zealander
Alaska Native
Master's Degree
Master's Degree Comparison
New Zealanders
Alaska Natives
18.3%
MASTER'S DEGREE
99.9/ 100
METRIC RATING
60th/ 347
METRIC RANK
11.6%
MASTER'S DEGREE
0.1/ 100
METRIC RATING
293rd/ 347
METRIC RANK
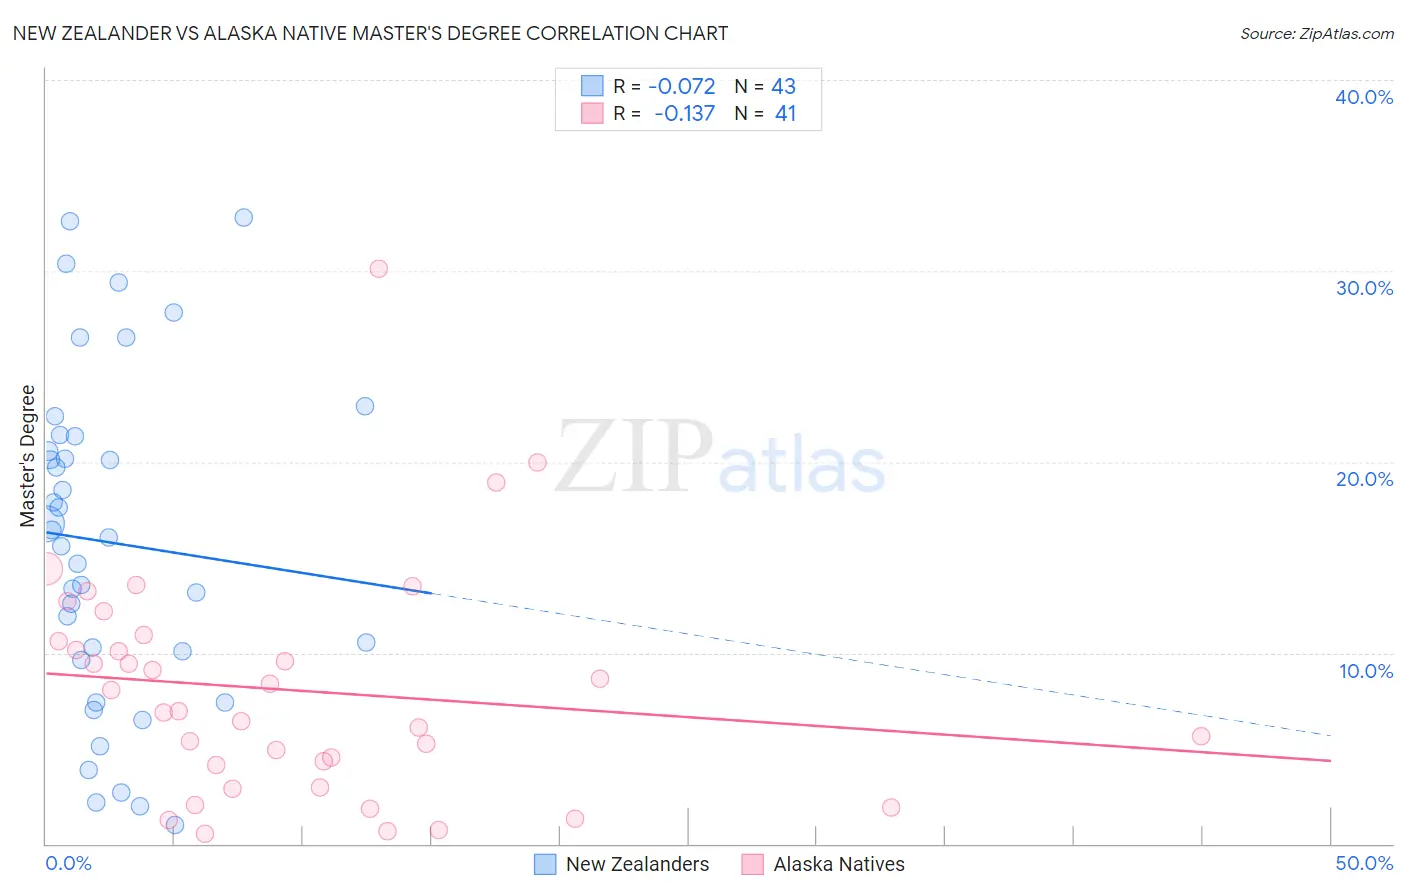
New Zealander vs Alaska Native Master's Degree Correlation Chart
The statistical analysis conducted on geographies consisting of 106,899,684 people shows a slight negative correlation between the proportion of New Zealanders and percentage of population with at least master's degree education in the United States with a correlation coefficient (R) of -0.072 and weighted average of 18.3%. Similarly, the statistical analysis conducted on geographies consisting of 76,746,522 people shows a poor negative correlation between the proportion of Alaska Natives and percentage of population with at least master's degree education in the United States with a correlation coefficient (R) of -0.137 and weighted average of 11.6%, a difference of 57.5%.
Master's Degree Correlation Summary
| Measurement | New Zealander | Alaska Native |
| Minimum | 1.0% | 0.50% |
| Maximum | 32.8% | 30.1% |
| Range | 31.8% | 29.6% |
| Mean | 15.8% | 8.0% |
| Median | 16.0% | 7.0% |
| Interquartile 25% (IQ1) | 9.6% | 3.5% |
| Interquartile 75% (IQ3) | 21.3% | 10.8% |
| Interquartile Range (IQR) | 11.7% | 7.2% |
| Standard Deviation (Sample) | 8.6% | 6.0% |
| Standard Deviation (Population) | 8.5% | 5.9% |
Similar Demographics by Master's Degree
Demographics Similar to New Zealanders by Master's Degree
In terms of master's degree, the demographic groups most similar to New Zealanders are Immigrants from Europe (18.2%, a difference of 0.15%), Immigrants from Bulgaria (18.3%, a difference of 0.23%), Argentinean (18.2%, a difference of 0.51%), Australian (18.4%, a difference of 0.66%), and Immigrants from Asia (18.4%, a difference of 0.80%).
| Demographics | Rating | Rank | Master's Degree |
| Immigrants | Czechoslovakia | 99.9 /100 | #53 | Exceptional 18.5% |
| Immigrants | Lithuania | 99.9 /100 | #54 | Exceptional 18.5% |
| Immigrants | Serbia | 99.9 /100 | #55 | Exceptional 18.5% |
| Asians | 99.9 /100 | #56 | Exceptional 18.4% |
| Immigrants | Asia | 99.9 /100 | #57 | Exceptional 18.4% |
| Australians | 99.9 /100 | #58 | Exceptional 18.4% |
| Immigrants | Bulgaria | 99.9 /100 | #59 | Exceptional 18.3% |
| New Zealanders | 99.9 /100 | #60 | Exceptional 18.3% |
| Immigrants | Europe | 99.9 /100 | #61 | Exceptional 18.2% |
| Argentineans | 99.9 /100 | #62 | Exceptional 18.2% |
| Immigrants | Netherlands | 99.9 /100 | #63 | Exceptional 18.1% |
| South Africans | 99.9 /100 | #64 | Exceptional 18.1% |
| Immigrants | Kazakhstan | 99.8 /100 | #65 | Exceptional 18.0% |
| Ethiopians | 99.8 /100 | #66 | Exceptional 18.0% |
| Immigrants | Argentina | 99.8 /100 | #67 | Exceptional 18.0% |
Demographics Similar to Alaska Natives by Master's Degree
In terms of master's degree, the demographic groups most similar to Alaska Natives are Hawaiian (11.6%, a difference of 0.10%), Immigrants from Guatemala (11.6%, a difference of 0.23%), Marshallese (11.6%, a difference of 0.25%), Alaskan Athabascan (11.6%, a difference of 0.26%), and Colville (11.6%, a difference of 0.35%).
| Demographics | Rating | Rank | Master's Degree |
| Aleuts | 0.1 /100 | #286 | Tragic 11.8% |
| Immigrants | Haiti | 0.1 /100 | #287 | Tragic 11.8% |
| Immigrants | Honduras | 0.1 /100 | #288 | Tragic 11.8% |
| Guatemalans | 0.1 /100 | #289 | Tragic 11.7% |
| Ute | 0.1 /100 | #290 | Tragic 11.7% |
| Colville | 0.1 /100 | #291 | Tragic 11.6% |
| Immigrants | Guatemala | 0.1 /100 | #292 | Tragic 11.6% |
| Alaska Natives | 0.1 /100 | #293 | Tragic 11.6% |
| Hawaiians | 0.1 /100 | #294 | Tragic 11.6% |
| Marshallese | 0.1 /100 | #295 | Tragic 11.6% |
| Alaskan Athabascans | 0.1 /100 | #296 | Tragic 11.6% |
| Immigrants | Yemen | 0.1 /100 | #297 | Tragic 11.6% |
| Samoans | 0.1 /100 | #298 | Tragic 11.5% |
| Chickasaw | 0.1 /100 | #299 | Tragic 11.4% |
| Chippewa | 0.1 /100 | #300 | Tragic 11.4% |