Immigrants from Guyana vs French Master's Degree
COMPARE
Immigrants from Guyana
French
Master's Degree
Master's Degree Comparison
Immigrants from Guyana
French
13.4%
MASTER'S DEGREE
4.4/ 100
METRIC RATING
236th/ 347
METRIC RANK
14.4%
MASTER'S DEGREE
23.7/ 100
METRIC RATING
204th/ 347
METRIC RANK
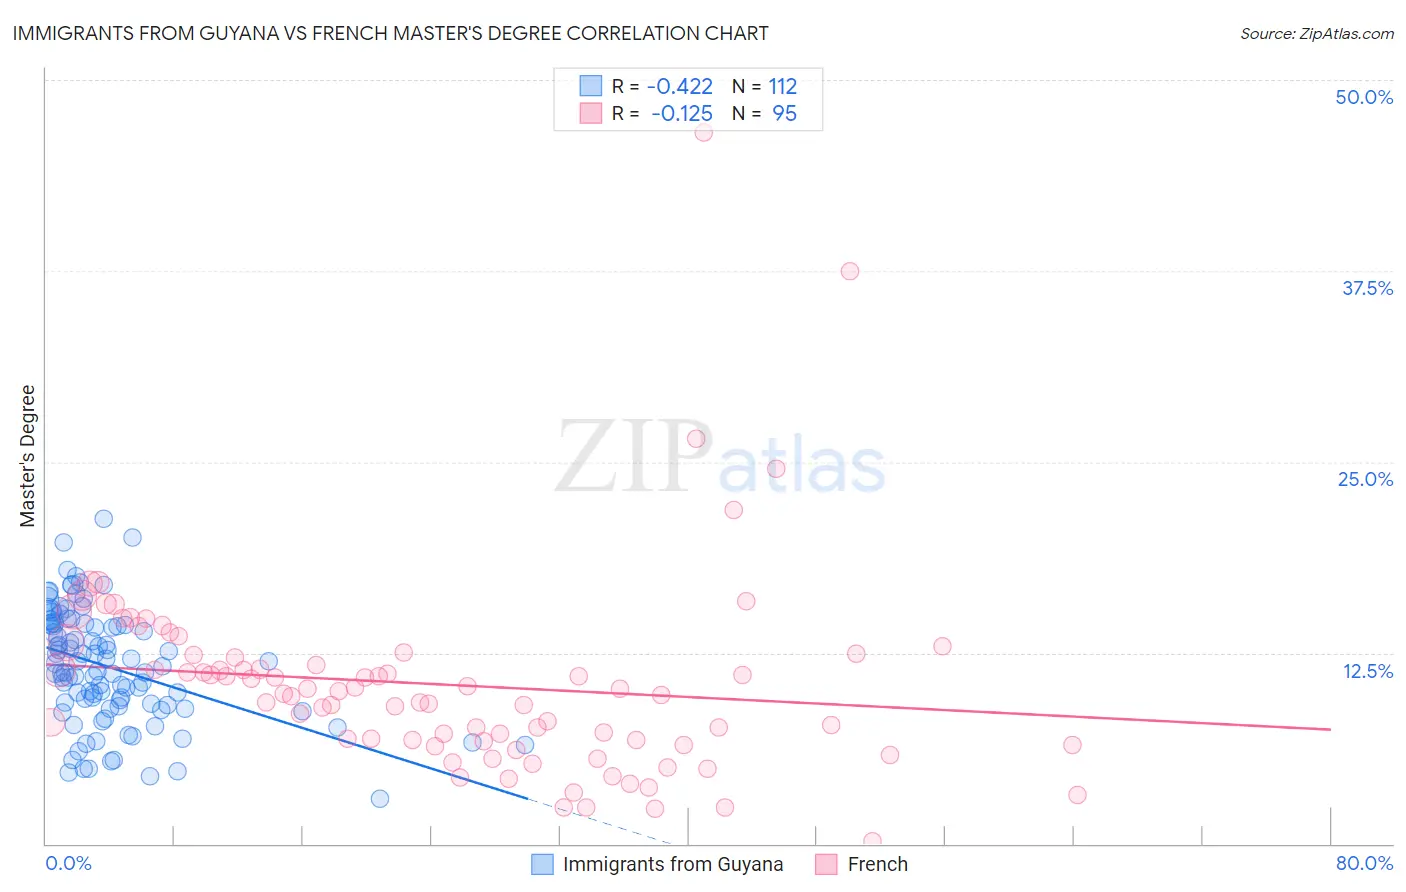
Immigrants from Guyana vs French Master's Degree Correlation Chart
The statistical analysis conducted on geographies consisting of 183,731,921 people shows a moderate negative correlation between the proportion of Immigrants from Guyana and percentage of population with at least master's degree education in the United States with a correlation coefficient (R) of -0.422 and weighted average of 13.4%. Similarly, the statistical analysis conducted on geographies consisting of 571,581,323 people shows a poor negative correlation between the proportion of French and percentage of population with at least master's degree education in the United States with a correlation coefficient (R) of -0.125 and weighted average of 14.4%, a difference of 6.8%.
Master's Degree Correlation Summary
| Measurement | Immigrants from Guyana | French |
| Minimum | 3.0% | 0.20% |
| Maximum | 21.2% | 46.6% |
| Range | 18.3% | 46.4% |
| Mean | 11.6% | 10.4% |
| Median | 11.5% | 9.8% |
| Interquartile 25% (IQ1) | 9.1% | 6.7% |
| Interquartile 75% (IQ3) | 14.3% | 12.4% |
| Interquartile Range (IQR) | 5.3% | 5.7% |
| Standard Deviation (Sample) | 3.7% | 6.6% |
| Standard Deviation (Population) | 3.7% | 6.6% |
Similar Demographics by Master's Degree
Demographics Similar to Immigrants from Guyana by Master's Degree
In terms of master's degree, the demographic groups most similar to Immigrants from Guyana are German Russian (13.5%, a difference of 0.11%), Jamaican (13.4%, a difference of 0.22%), Hmong (13.4%, a difference of 0.36%), Immigrants from Burma/Myanmar (13.5%, a difference of 0.52%), and Nonimmigrants (13.3%, a difference of 0.89%).
| Demographics | Rating | Rank | Master's Degree |
| British West Indians | 8.8 /100 | #229 | Tragic 13.8% |
| Dutch | 8.7 /100 | #230 | Tragic 13.8% |
| Guyanese | 7.6 /100 | #231 | Tragic 13.7% |
| Immigrants | Philippines | 6.0 /100 | #232 | Tragic 13.6% |
| Immigrants | Ecuador | 5.7 /100 | #233 | Tragic 13.6% |
| Immigrants | Burma/Myanmar | 5.0 /100 | #234 | Tragic 13.5% |
| German Russians | 4.5 /100 | #235 | Tragic 13.5% |
| Immigrants | Guyana | 4.4 /100 | #236 | Tragic 13.4% |
| Jamaicans | 4.1 /100 | #237 | Tragic 13.4% |
| Hmong | 4.0 /100 | #238 | Tragic 13.4% |
| Immigrants | Nonimmigrants | 3.4 /100 | #239 | Tragic 13.3% |
| Guamanians/Chamorros | 2.2 /100 | #240 | Tragic 13.1% |
| U.S. Virgin Islanders | 2.1 /100 | #241 | Tragic 13.1% |
| Spanish Americans | 1.9 /100 | #242 | Tragic 13.0% |
| Immigrants | Jamaica | 1.9 /100 | #243 | Tragic 13.0% |
Demographics Similar to French by Master's Degree
In terms of master's degree, the demographic groups most similar to French are Trinidadian and Tobagonian (14.4%, a difference of 0.030%), Scandinavian (14.4%, a difference of 0.070%), Yugoslavian (14.4%, a difference of 0.11%), Immigrants from Western Africa (14.4%, a difference of 0.22%), and Scotch-Irish (14.4%, a difference of 0.24%).
| Demographics | Rating | Rank | Master's Degree |
| Belgians | 28.0 /100 | #197 | Fair 14.5% |
| West Indians | 27.4 /100 | #198 | Fair 14.5% |
| Immigrants | Armenia | 27.2 /100 | #199 | Fair 14.5% |
| Panamanians | 25.1 /100 | #200 | Fair 14.4% |
| Scotch-Irish | 25.0 /100 | #201 | Fair 14.4% |
| Immigrants | Western Africa | 24.9 /100 | #202 | Fair 14.4% |
| Yugoslavians | 24.3 /100 | #203 | Fair 14.4% |
| French | 23.7 /100 | #204 | Fair 14.4% |
| Trinidadians and Tobagonians | 23.5 /100 | #205 | Fair 14.4% |
| Scandinavians | 23.3 /100 | #206 | Fair 14.4% |
| Immigrants | Bosnia and Herzegovina | 22.0 /100 | #207 | Fair 14.3% |
| Immigrants | Barbados | 20.5 /100 | #208 | Fair 14.3% |
| Immigrants | Panama | 20.0 /100 | #209 | Fair 14.3% |
| Sub-Saharan Africans | 19.4 /100 | #210 | Poor 14.2% |
| Somalis | 18.0 /100 | #211 | Poor 14.2% |