Immigrants from Belarus vs Alaska Native Associate's Degree
COMPARE
Immigrants from Belarus
Alaska Native
Associate's Degree
Associate's Degree Comparison
Immigrants from Belarus
Alaska Natives
52.8%
ASSOCIATE'S DEGREE
99.9/ 100
METRIC RATING
39th/ 347
METRIC RANK
37.5%
ASSOCIATE'S DEGREE
0.0/ 100
METRIC RATING
318th/ 347
METRIC RANK
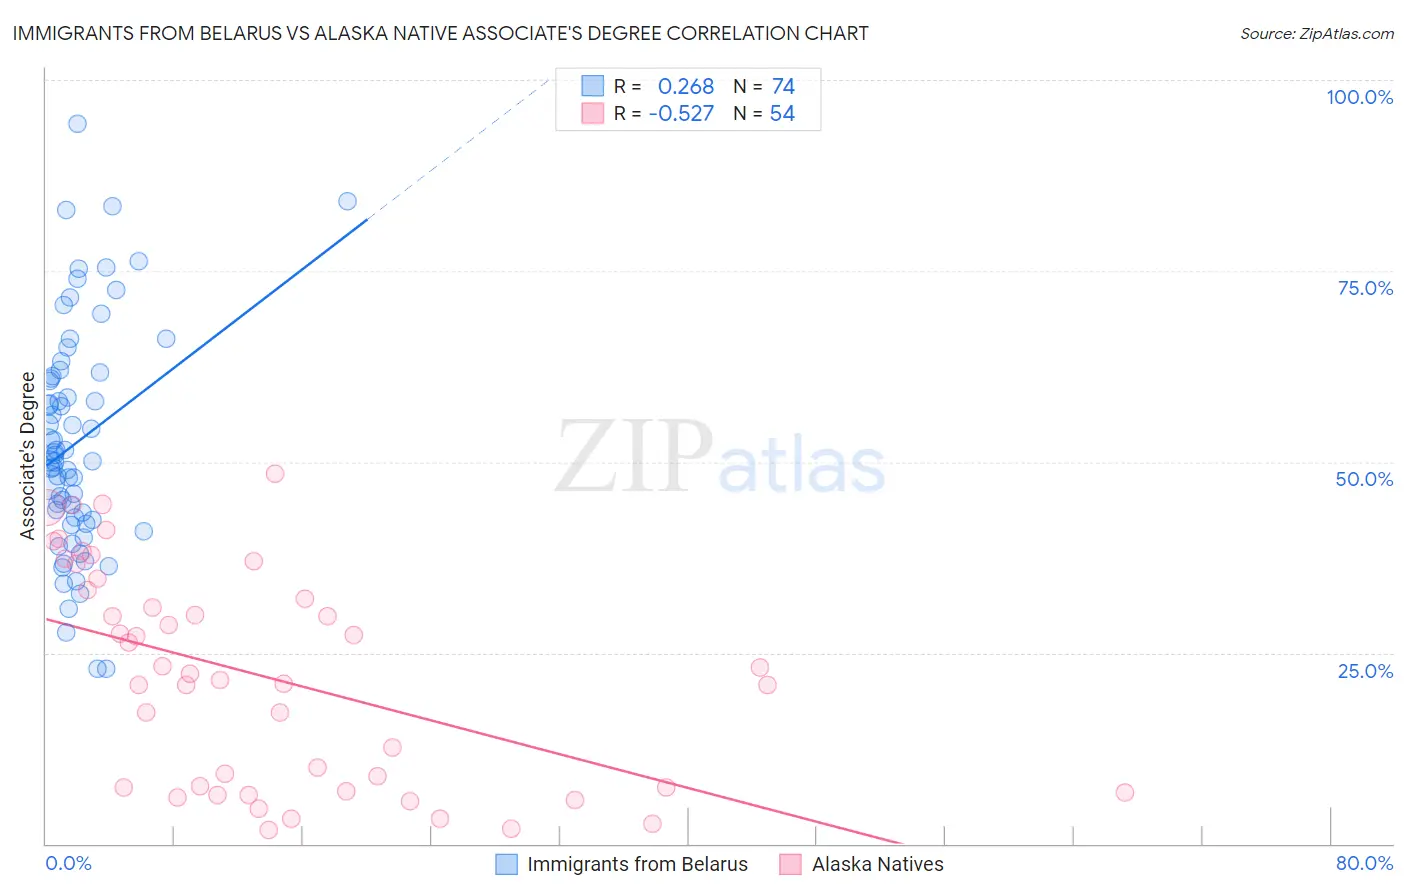
Immigrants from Belarus vs Alaska Native Associate's Degree Correlation Chart
The statistical analysis conducted on geographies consisting of 150,205,158 people shows a weak positive correlation between the proportion of Immigrants from Belarus and percentage of population with at least associate's degree education in the United States with a correlation coefficient (R) of 0.268 and weighted average of 52.8%. Similarly, the statistical analysis conducted on geographies consisting of 76,777,220 people shows a substantial negative correlation between the proportion of Alaska Natives and percentage of population with at least associate's degree education in the United States with a correlation coefficient (R) of -0.527 and weighted average of 37.5%, a difference of 41.0%.
Associate's Degree Correlation Summary
| Measurement | Immigrants from Belarus | Alaska Native |
| Minimum | 22.9% | 1.8% |
| Maximum | 94.2% | 48.5% |
| Range | 71.3% | 46.7% |
| Mean | 52.6% | 21.8% |
| Median | 50.5% | 21.9% |
| Interquartile 25% (IQ1) | 42.3% | 7.3% |
| Interquartile 75% (IQ3) | 61.3% | 33.2% |
| Interquartile Range (IQR) | 18.9% | 25.9% |
| Standard Deviation (Sample) | 14.8% | 14.0% |
| Standard Deviation (Population) | 14.7% | 13.9% |
Similar Demographics by Associate's Degree
Demographics Similar to Immigrants from Belarus by Associate's Degree
In terms of associate's degree, the demographic groups most similar to Immigrants from Belarus are Immigrants from Latvia (52.8%, a difference of 0.070%), Mongolian (53.0%, a difference of 0.29%), Immigrants from Denmark (53.1%, a difference of 0.45%), Immigrants from Saudi Arabia (52.6%, a difference of 0.50%), and Immigrants from Russia (53.1%, a difference of 0.53%).
| Demographics | Rating | Rank | Associate's Degree |
| Immigrants | Turkey | 100.0 /100 | #32 | Exceptional 53.4% |
| Israelis | 100.0 /100 | #33 | Exceptional 53.4% |
| Bulgarians | 100.0 /100 | #34 | Exceptional 53.3% |
| Russians | 100.0 /100 | #35 | Exceptional 53.2% |
| Immigrants | Russia | 100.0 /100 | #36 | Exceptional 53.1% |
| Immigrants | Denmark | 100.0 /100 | #37 | Exceptional 53.1% |
| Mongolians | 100.0 /100 | #38 | Exceptional 53.0% |
| Immigrants | Belarus | 99.9 /100 | #39 | Exceptional 52.8% |
| Immigrants | Latvia | 99.9 /100 | #40 | Exceptional 52.8% |
| Immigrants | Saudi Arabia | 99.9 /100 | #41 | Exceptional 52.6% |
| Immigrants | Malaysia | 99.9 /100 | #42 | Exceptional 52.5% |
| Immigrants | South Africa | 99.9 /100 | #43 | Exceptional 52.5% |
| Estonians | 99.9 /100 | #44 | Exceptional 52.5% |
| Immigrants | Lithuania | 99.9 /100 | #45 | Exceptional 52.4% |
| Immigrants | Bulgaria | 99.9 /100 | #46 | Exceptional 52.4% |
Demographics Similar to Alaska Natives by Associate's Degree
In terms of associate's degree, the demographic groups most similar to Alaska Natives are Fijian (37.4%, a difference of 0.22%), Yaqui (37.6%, a difference of 0.23%), Crow (37.6%, a difference of 0.25%), Cajun (37.4%, a difference of 0.25%), and Creek (37.6%, a difference of 0.26%).
| Demographics | Rating | Rank | Associate's Degree |
| Immigrants | Latin America | 0.0 /100 | #311 | Tragic 37.9% |
| Choctaw | 0.0 /100 | #312 | Tragic 37.8% |
| Hispanics or Latinos | 0.0 /100 | #313 | Tragic 37.7% |
| Seminole | 0.0 /100 | #314 | Tragic 37.7% |
| Creek | 0.0 /100 | #315 | Tragic 37.6% |
| Crow | 0.0 /100 | #316 | Tragic 37.6% |
| Yaqui | 0.0 /100 | #317 | Tragic 37.6% |
| Alaska Natives | 0.0 /100 | #318 | Tragic 37.5% |
| Fijians | 0.0 /100 | #319 | Tragic 37.4% |
| Cajuns | 0.0 /100 | #320 | Tragic 37.4% |
| Immigrants | Yemen | 0.0 /100 | #321 | Tragic 37.3% |
| Pennsylvania Germans | 0.0 /100 | #322 | Tragic 37.2% |
| Immigrants | Cabo Verde | 0.0 /100 | #323 | Tragic 36.8% |
| Arapaho | 0.0 /100 | #324 | Tragic 36.7% |
| Menominee | 0.0 /100 | #325 | Tragic 36.7% |