Immigrants from Guatemala vs Assyrian/Chaldean/Syriac Bachelor's Degree
COMPARE
Immigrants from Guatemala
Assyrian/Chaldean/Syriac
Bachelor's Degree
Bachelor's Degree Comparison
Immigrants from Guatemala
Assyrians/Chaldeans/Syriacs
30.8%
BACHELOR'S DEGREE
0.0/ 100
METRIC RATING
294th/ 347
METRIC RANK
39.8%
BACHELOR'S DEGREE
89.4/ 100
METRIC RATING
134th/ 347
METRIC RANK
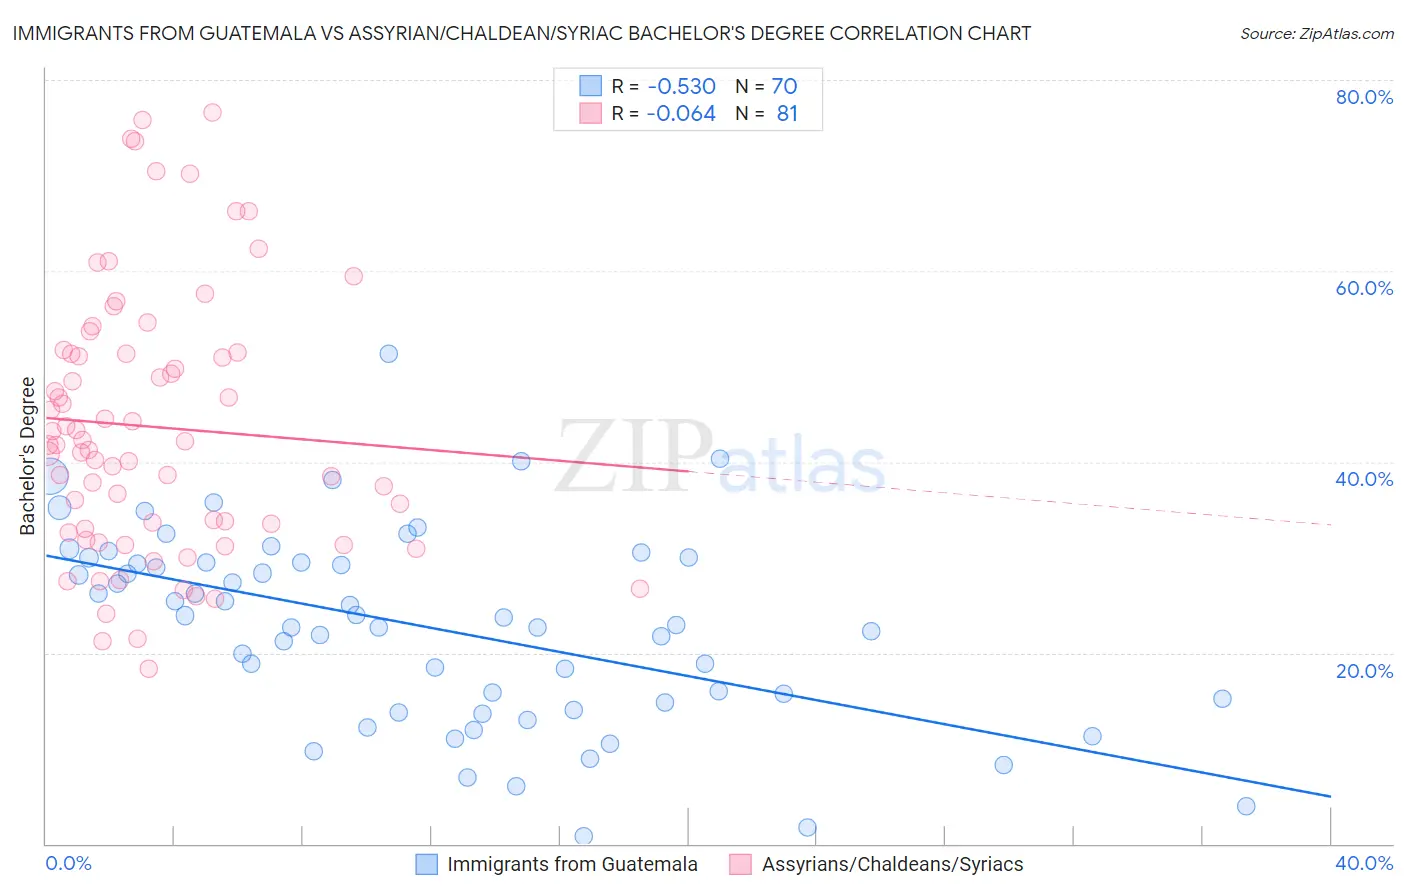
Immigrants from Guatemala vs Assyrian/Chaldean/Syriac Bachelor's Degree Correlation Chart
The statistical analysis conducted on geographies consisting of 377,260,435 people shows a substantial negative correlation between the proportion of Immigrants from Guatemala and percentage of population with at least bachelor's degree education in the United States with a correlation coefficient (R) of -0.530 and weighted average of 30.8%. Similarly, the statistical analysis conducted on geographies consisting of 110,314,164 people shows a slight negative correlation between the proportion of Assyrians/Chaldeans/Syriacs and percentage of population with at least bachelor's degree education in the United States with a correlation coefficient (R) of -0.064 and weighted average of 39.8%, a difference of 29.4%.
Bachelor's Degree Correlation Summary
| Measurement | Immigrants from Guatemala | Assyrian/Chaldean/Syriac |
| Minimum | 0.73% | 18.3% |
| Maximum | 51.3% | 76.7% |
| Range | 50.6% | 58.4% |
| Mean | 22.7% | 43.7% |
| Median | 23.3% | 41.8% |
| Interquartile 25% (IQ1) | 14.7% | 32.8% |
| Interquartile 75% (IQ3) | 29.5% | 51.4% |
| Interquartile Range (IQR) | 14.7% | 18.6% |
| Standard Deviation (Sample) | 10.2% | 13.8% |
| Standard Deviation (Population) | 10.1% | 13.7% |
Similar Demographics by Bachelor's Degree
Demographics Similar to Immigrants from Guatemala by Bachelor's Degree
In terms of bachelor's degree, the demographic groups most similar to Immigrants from Guatemala are Immigrants from Dominican Republic (30.7%, a difference of 0.24%), Puget Sound Salish (30.7%, a difference of 0.34%), Cape Verdean (30.9%, a difference of 0.40%), Immigrants from Haiti (30.6%, a difference of 0.40%), and Ute (30.9%, a difference of 0.49%).
| Demographics | Rating | Rank | Bachelor's Degree |
| Ottawa | 0.1 /100 | #287 | Tragic 31.1% |
| Guatemalans | 0.1 /100 | #288 | Tragic 31.0% |
| Puerto Ricans | 0.1 /100 | #289 | Tragic 31.0% |
| Immigrants | Honduras | 0.1 /100 | #290 | Tragic 30.9% |
| Blacks/African Americans | 0.1 /100 | #291 | Tragic 30.9% |
| Ute | 0.1 /100 | #292 | Tragic 30.9% |
| Cape Verdeans | 0.1 /100 | #293 | Tragic 30.9% |
| Immigrants | Guatemala | 0.0 /100 | #294 | Tragic 30.8% |
| Immigrants | Dominican Republic | 0.0 /100 | #295 | Tragic 30.7% |
| Puget Sound Salish | 0.0 /100 | #296 | Tragic 30.7% |
| Immigrants | Haiti | 0.0 /100 | #297 | Tragic 30.6% |
| Chippewa | 0.0 /100 | #298 | Tragic 30.6% |
| Chickasaw | 0.0 /100 | #299 | Tragic 30.4% |
| Immigrants | Micronesia | 0.0 /100 | #300 | Tragic 30.4% |
| Immigrants | Cuba | 0.0 /100 | #301 | Tragic 30.3% |
Demographics Similar to Assyrians/Chaldeans/Syriacs by Bachelor's Degree
In terms of bachelor's degree, the demographic groups most similar to Assyrians/Chaldeans/Syriacs are Luxembourger (39.8%, a difference of 0.080%), Pakistani (39.7%, a difference of 0.28%), Immigrants from Southern Europe (40.0%, a difference of 0.43%), Taiwanese (40.0%, a difference of 0.44%), and Icelander (39.5%, a difference of 0.65%).
| Demographics | Rating | Rank | Bachelor's Degree |
| Immigrants | Jordan | 93.4 /100 | #127 | Exceptional 40.3% |
| Immigrants | Venezuela | 92.9 /100 | #128 | Exceptional 40.2% |
| Serbians | 92.4 /100 | #129 | Exceptional 40.1% |
| Sierra Leoneans | 92.2 /100 | #130 | Exceptional 40.1% |
| Italians | 91.9 /100 | #131 | Exceptional 40.1% |
| Taiwanese | 91.1 /100 | #132 | Exceptional 40.0% |
| Immigrants | Southern Europe | 91.1 /100 | #133 | Exceptional 40.0% |
| Assyrians/Chaldeans/Syriacs | 89.4 /100 | #134 | Excellent 39.8% |
| Luxembourgers | 89.1 /100 | #135 | Excellent 39.8% |
| Pakistanis | 88.2 /100 | #136 | Excellent 39.7% |
| Icelanders | 86.5 /100 | #137 | Excellent 39.5% |
| Europeans | 85.6 /100 | #138 | Excellent 39.5% |
| Immigrants | Sudan | 84.5 /100 | #139 | Excellent 39.4% |
| Immigrants | Armenia | 84.1 /100 | #140 | Excellent 39.4% |
| South American Indians | 83.6 /100 | #141 | Excellent 39.3% |