Immigrants from Guatemala vs Arapaho Bachelor's Degree
COMPARE
Immigrants from Guatemala
Arapaho
Bachelor's Degree
Bachelor's Degree Comparison
Immigrants from Guatemala
Arapaho
30.8%
BACHELOR'S DEGREE
0.0/ 100
METRIC RATING
294th/ 347
METRIC RANK
26.6%
BACHELOR'S DEGREE
0.0/ 100
METRIC RATING
334th/ 347
METRIC RANK
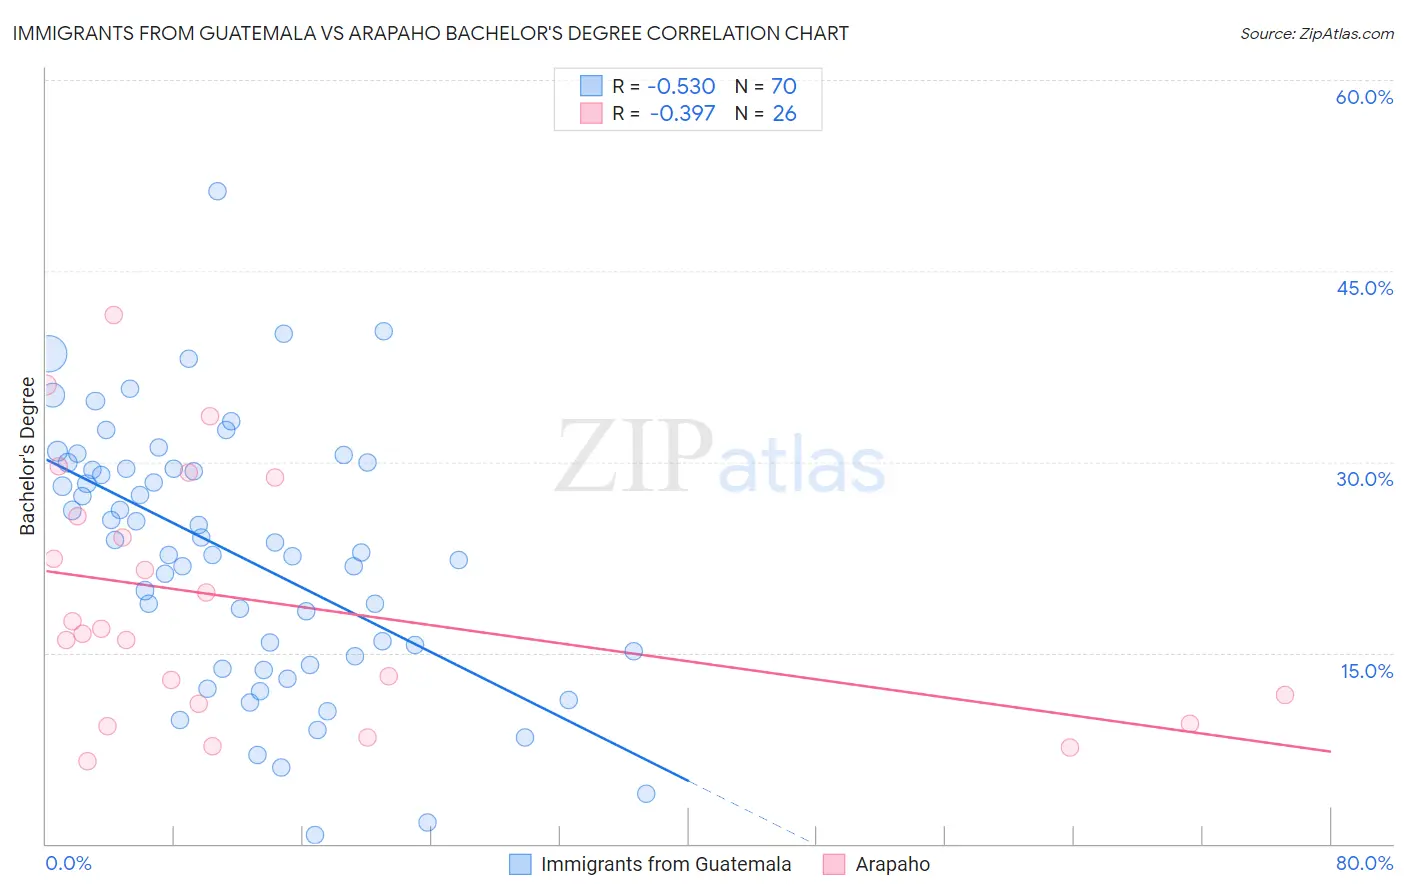
Immigrants from Guatemala vs Arapaho Bachelor's Degree Correlation Chart
The statistical analysis conducted on geographies consisting of 377,260,435 people shows a substantial negative correlation between the proportion of Immigrants from Guatemala and percentage of population with at least bachelor's degree education in the United States with a correlation coefficient (R) of -0.530 and weighted average of 30.8%. Similarly, the statistical analysis conducted on geographies consisting of 29,779,045 people shows a mild negative correlation between the proportion of Arapaho and percentage of population with at least bachelor's degree education in the United States with a correlation coefficient (R) of -0.397 and weighted average of 26.6%, a difference of 15.5%.
Bachelor's Degree Correlation Summary
| Measurement | Immigrants from Guatemala | Arapaho |
| Minimum | 0.73% | 6.4% |
| Maximum | 51.3% | 41.6% |
| Range | 50.6% | 35.1% |
| Mean | 22.7% | 18.9% |
| Median | 23.3% | 16.7% |
| Interquartile 25% (IQ1) | 14.7% | 11.0% |
| Interquartile 75% (IQ3) | 29.5% | 25.8% |
| Interquartile Range (IQR) | 14.7% | 14.8% |
| Standard Deviation (Sample) | 10.2% | 9.7% |
| Standard Deviation (Population) | 10.1% | 9.5% |
Similar Demographics by Bachelor's Degree
Demographics Similar to Immigrants from Guatemala by Bachelor's Degree
In terms of bachelor's degree, the demographic groups most similar to Immigrants from Guatemala are Immigrants from Dominican Republic (30.7%, a difference of 0.24%), Puget Sound Salish (30.7%, a difference of 0.34%), Cape Verdean (30.9%, a difference of 0.40%), Immigrants from Haiti (30.6%, a difference of 0.40%), and Ute (30.9%, a difference of 0.49%).
| Demographics | Rating | Rank | Bachelor's Degree |
| Ottawa | 0.1 /100 | #287 | Tragic 31.1% |
| Guatemalans | 0.1 /100 | #288 | Tragic 31.0% |
| Puerto Ricans | 0.1 /100 | #289 | Tragic 31.0% |
| Immigrants | Honduras | 0.1 /100 | #290 | Tragic 30.9% |
| Blacks/African Americans | 0.1 /100 | #291 | Tragic 30.9% |
| Ute | 0.1 /100 | #292 | Tragic 30.9% |
| Cape Verdeans | 0.1 /100 | #293 | Tragic 30.9% |
| Immigrants | Guatemala | 0.0 /100 | #294 | Tragic 30.8% |
| Immigrants | Dominican Republic | 0.0 /100 | #295 | Tragic 30.7% |
| Puget Sound Salish | 0.0 /100 | #296 | Tragic 30.7% |
| Immigrants | Haiti | 0.0 /100 | #297 | Tragic 30.6% |
| Chippewa | 0.0 /100 | #298 | Tragic 30.6% |
| Chickasaw | 0.0 /100 | #299 | Tragic 30.4% |
| Immigrants | Micronesia | 0.0 /100 | #300 | Tragic 30.4% |
| Immigrants | Cuba | 0.0 /100 | #301 | Tragic 30.3% |
Demographics Similar to Arapaho by Bachelor's Degree
In terms of bachelor's degree, the demographic groups most similar to Arapaho are Native/Alaskan (26.3%, a difference of 1.1%), Mexican (27.1%, a difference of 1.7%), Immigrants from Mexico (26.1%, a difference of 1.9%), Menominee (27.3%, a difference of 2.5%), and Immigrants from the Azores (27.3%, a difference of 2.6%).
| Demographics | Rating | Rank | Bachelor's Degree |
| Paiute | 0.0 /100 | #327 | Tragic 28.1% |
| Crow | 0.0 /100 | #328 | Tragic 27.7% |
| Immigrants | Central America | 0.0 /100 | #329 | Tragic 27.5% |
| Spanish American Indians | 0.0 /100 | #330 | Tragic 27.5% |
| Immigrants | Azores | 0.0 /100 | #331 | Tragic 27.3% |
| Menominee | 0.0 /100 | #332 | Tragic 27.3% |
| Mexicans | 0.0 /100 | #333 | Tragic 27.1% |
| Arapaho | 0.0 /100 | #334 | Tragic 26.6% |
| Natives/Alaskans | 0.0 /100 | #335 | Tragic 26.3% |
| Immigrants | Mexico | 0.0 /100 | #336 | Tragic 26.1% |
| Inupiat | 0.0 /100 | #337 | Tragic 25.8% |
| Pueblo | 0.0 /100 | #338 | Tragic 25.5% |
| Hopi | 0.0 /100 | #339 | Tragic 25.3% |
| Lumbee | 0.0 /100 | #340 | Tragic 24.8% |
| Yuman | 0.0 /100 | #341 | Tragic 24.5% |