Immigrants from Guatemala vs Assyrian/Chaldean/Syriac Unemployment Among Ages 35 to 44 years
COMPARE
Immigrants from Guatemala
Assyrian/Chaldean/Syriac
Unemployment Among Ages 35 to 44 years
Unemployment Among Ages 35 to 44 years Comparison
Immigrants from Guatemala
Assyrians/Chaldeans/Syriacs
5.2%
UNEMPLOYMENT AMONG AGES 35 TO 44 YEARS
0.4/ 100
METRIC RATING
246th/ 347
METRIC RANK
4.3%
UNEMPLOYMENT AMONG AGES 35 TO 44 YEARS
99.3/ 100
METRIC RATING
27th/ 347
METRIC RANK
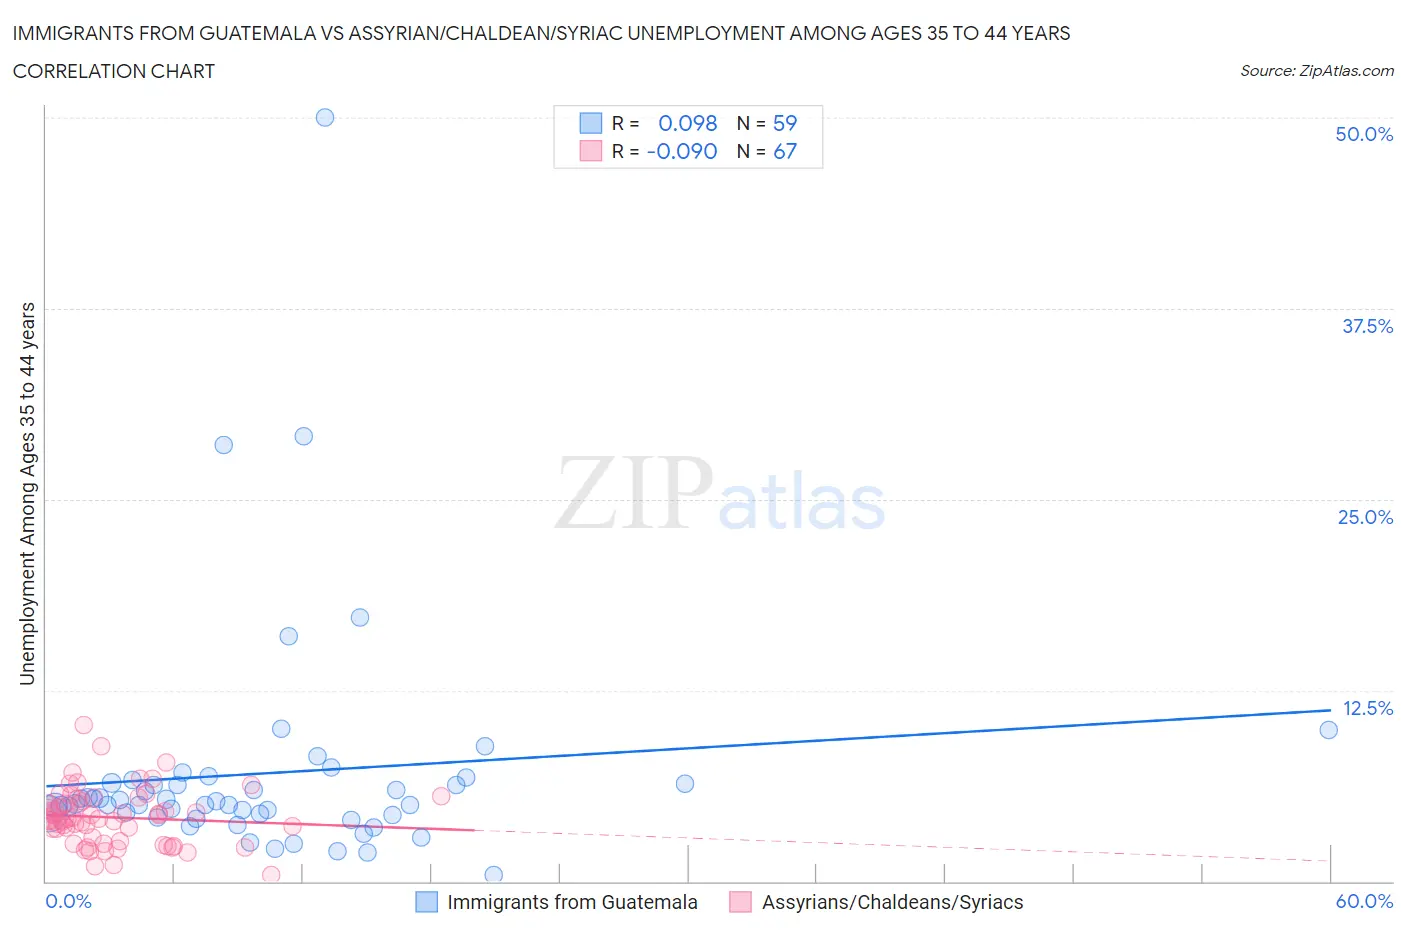
Immigrants from Guatemala vs Assyrian/Chaldean/Syriac Unemployment Among Ages 35 to 44 years Correlation Chart
The statistical analysis conducted on geographies consisting of 370,619,643 people shows a slight positive correlation between the proportion of Immigrants from Guatemala and unemployment rate among population between the ages 35 and 44 in the United States with a correlation coefficient (R) of 0.098 and weighted average of 5.2%. Similarly, the statistical analysis conducted on geographies consisting of 109,865,928 people shows a slight negative correlation between the proportion of Assyrians/Chaldeans/Syriacs and unemployment rate among population between the ages 35 and 44 in the United States with a correlation coefficient (R) of -0.090 and weighted average of 4.3%, a difference of 20.5%.
Unemployment Among Ages 35 to 44 years Correlation Summary
| Measurement | Immigrants from Guatemala | Assyrian/Chaldean/Syriac |
| Minimum | 0.40% | 0.40% |
| Maximum | 50.0% | 10.2% |
| Range | 49.6% | 9.8% |
| Mean | 7.1% | 4.2% |
| Median | 5.0% | 4.1% |
| Interquartile 25% (IQ1) | 4.3% | 2.6% |
| Interquartile 75% (IQ3) | 6.4% | 5.2% |
| Interquartile Range (IQR) | 2.1% | 2.6% |
| Standard Deviation (Sample) | 7.6% | 1.8% |
| Standard Deviation (Population) | 7.6% | 1.8% |
Similar Demographics by Unemployment Among Ages 35 to 44 years
Demographics Similar to Immigrants from Guatemala by Unemployment Among Ages 35 to 44 years
In terms of unemployment among ages 35 to 44 years, the demographic groups most similar to Immigrants from Guatemala are Bahamian (5.2%, a difference of 0.0%), Immigrants from Somalia (5.2%, a difference of 0.16%), Salvadoran (5.1%, a difference of 0.26%), Guatemalan (5.1%, a difference of 0.26%), and Delaware (5.1%, a difference of 0.38%).
| Demographics | Rating | Rank | Unemployment Among Ages 35 to 44 years |
| Nigerians | 0.7 /100 | #239 | Tragic 5.1% |
| Somalis | 0.7 /100 | #240 | Tragic 5.1% |
| Immigrants | Honduras | 0.6 /100 | #241 | Tragic 5.1% |
| Delaware | 0.5 /100 | #242 | Tragic 5.1% |
| Salvadorans | 0.4 /100 | #243 | Tragic 5.1% |
| Guatemalans | 0.4 /100 | #244 | Tragic 5.1% |
| Bahamians | 0.4 /100 | #245 | Tragic 5.2% |
| Immigrants | Guatemala | 0.4 /100 | #246 | Tragic 5.2% |
| Immigrants | Somalia | 0.3 /100 | #247 | Tragic 5.2% |
| Alsatians | 0.2 /100 | #248 | Tragic 5.2% |
| Immigrants | Liberia | 0.2 /100 | #249 | Tragic 5.2% |
| Immigrants | El Salvador | 0.2 /100 | #250 | Tragic 5.2% |
| Comanche | 0.2 /100 | #251 | Tragic 5.2% |
| Armenians | 0.2 /100 | #252 | Tragic 5.2% |
| Mexican American Indians | 0.2 /100 | #253 | Tragic 5.2% |
Demographics Similar to Assyrians/Chaldeans/Syriacs by Unemployment Among Ages 35 to 44 years
In terms of unemployment among ages 35 to 44 years, the demographic groups most similar to Assyrians/Chaldeans/Syriacs are Turkish (4.3%, a difference of 0.020%), Bulgarian (4.3%, a difference of 0.080%), Immigrants from Japan (4.3%, a difference of 0.080%), European (4.3%, a difference of 0.27%), and Immigrants from Pakistan (4.3%, a difference of 0.34%).
| Demographics | Rating | Rank | Unemployment Among Ages 35 to 44 years |
| Immigrants | Bolivia | 99.7 /100 | #20 | Exceptional 4.2% |
| Paraguayans | 99.6 /100 | #21 | Exceptional 4.2% |
| Scandinavians | 99.5 /100 | #22 | Exceptional 4.2% |
| Immigrants | Kuwait | 99.5 /100 | #23 | Exceptional 4.3% |
| Tlingit-Haida | 99.5 /100 | #24 | Exceptional 4.3% |
| Bulgarians | 99.3 /100 | #25 | Exceptional 4.3% |
| Turks | 99.3 /100 | #26 | Exceptional 4.3% |
| Assyrians/Chaldeans/Syriacs | 99.3 /100 | #27 | Exceptional 4.3% |
| Immigrants | Japan | 99.3 /100 | #28 | Exceptional 4.3% |
| Europeans | 99.2 /100 | #29 | Exceptional 4.3% |
| Immigrants | Pakistan | 99.2 /100 | #30 | Exceptional 4.3% |
| Carpatho Rusyns | 99.2 /100 | #31 | Exceptional 4.3% |
| Chinese | 99.1 /100 | #32 | Exceptional 4.3% |
| Immigrants | Sri Lanka | 99.1 /100 | #33 | Exceptional 4.3% |
| Jordanians | 99.0 /100 | #34 | Exceptional 4.3% |