Immigrants from Guatemala vs Assyrian/Chaldean/Syriac 3rd Grade
COMPARE
Immigrants from Guatemala
Assyrian/Chaldean/Syriac
3rd Grade
3rd Grade Comparison
Immigrants from Guatemala
Assyrians/Chaldeans/Syriacs
95.8%
3RD GRADE
0.0/ 100
METRIC RATING
342nd/ 347
METRIC RANK
97.4%
3RD GRADE
1.0/ 100
METRIC RATING
247th/ 347
METRIC RANK
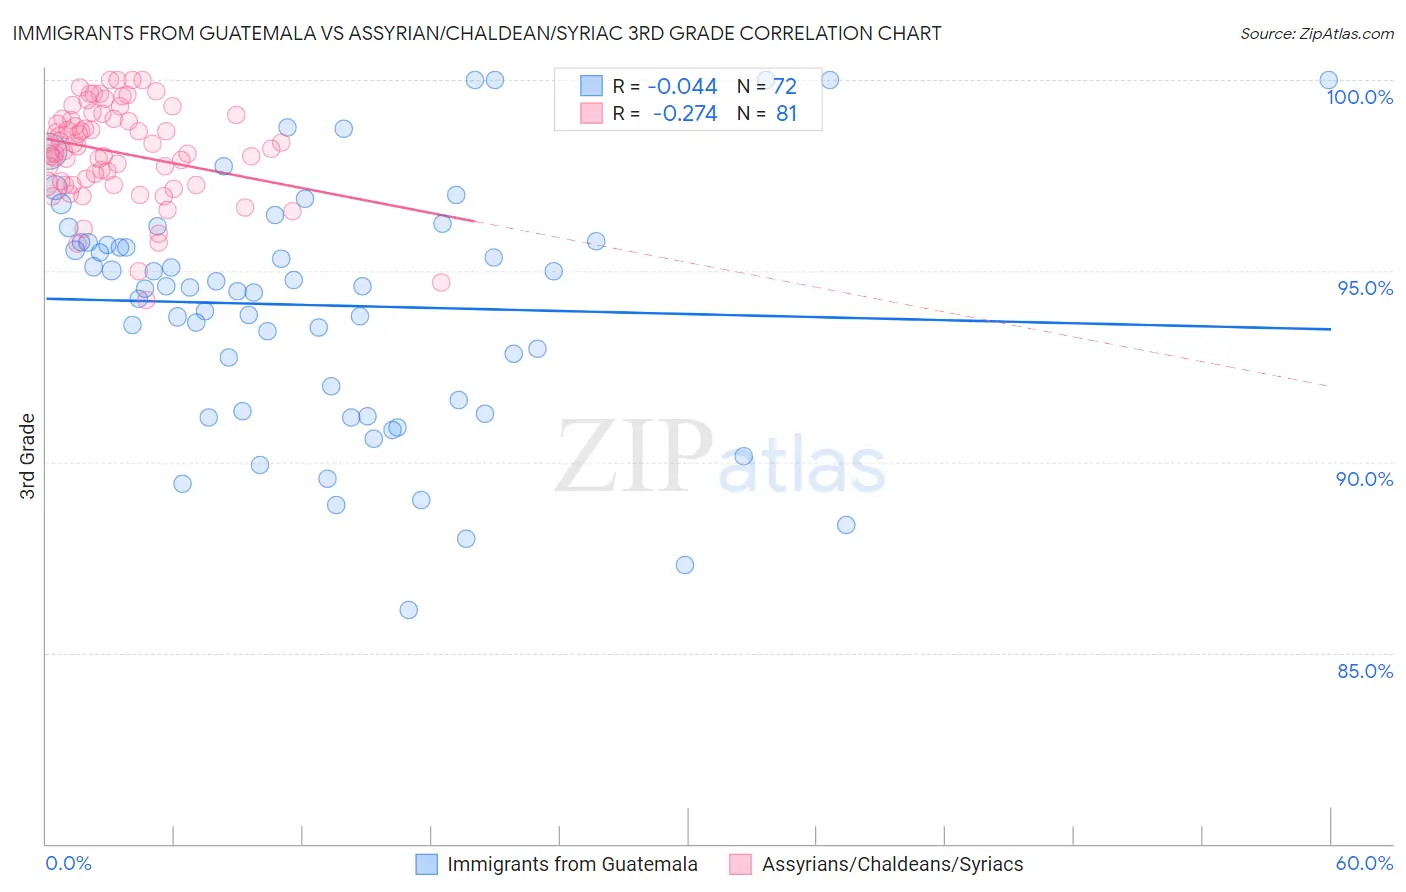
Immigrants from Guatemala vs Assyrian/Chaldean/Syriac 3rd Grade Correlation Chart
The statistical analysis conducted on geographies consisting of 377,282,938 people shows no correlation between the proportion of Immigrants from Guatemala and percentage of population with at least 3rd grade education in the United States with a correlation coefficient (R) of -0.044 and weighted average of 95.8%. Similarly, the statistical analysis conducted on geographies consisting of 110,318,304 people shows a weak negative correlation between the proportion of Assyrians/Chaldeans/Syriacs and percentage of population with at least 3rd grade education in the United States with a correlation coefficient (R) of -0.274 and weighted average of 97.4%, a difference of 1.6%.
3rd Grade Correlation Summary
| Measurement | Immigrants from Guatemala | Assyrian/Chaldean/Syriac |
| Minimum | 86.1% | 94.2% |
| Maximum | 100.0% | 100.0% |
| Range | 13.9% | 5.8% |
| Mean | 94.1% | 98.1% |
| Median | 94.6% | 98.2% |
| Interquartile 25% (IQ1) | 91.5% | 97.3% |
| Interquartile 75% (IQ3) | 95.8% | 99.0% |
| Interquartile Range (IQR) | 4.3% | 1.7% |
| Standard Deviation (Sample) | 3.2% | 1.3% |
| Standard Deviation (Population) | 3.2% | 1.2% |
Similar Demographics by 3rd Grade
Demographics Similar to Immigrants from Guatemala by 3rd Grade
In terms of 3rd grade, the demographic groups most similar to Immigrants from Guatemala are Immigrants from Central America (95.8%, a difference of 0.0%), Immigrants from Mexico (95.8%, a difference of 0.040%), Nepalese (95.9%, a difference of 0.060%), Yakama (95.9%, a difference of 0.13%), and Salvadoran (95.7%, a difference of 0.14%).
| Demographics | Rating | Rank | 3rd Grade |
| Immigrants | Fiji | 0.0 /100 | #333 | Tragic 96.2% |
| Immigrants | Cambodia | 0.0 /100 | #334 | Tragic 96.2% |
| Immigrants | Dominican Republic | 0.0 /100 | #335 | Tragic 96.2% |
| Immigrants | Cabo Verde | 0.0 /100 | #336 | Tragic 96.2% |
| Central Americans | 0.0 /100 | #337 | Tragic 96.1% |
| Guatemalans | 0.0 /100 | #338 | Tragic 96.0% |
| Yakama | 0.0 /100 | #339 | Tragic 95.9% |
| Nepalese | 0.0 /100 | #340 | Tragic 95.9% |
| Immigrants | Central America | 0.0 /100 | #341 | Tragic 95.8% |
| Immigrants | Guatemala | 0.0 /100 | #342 | Tragic 95.8% |
| Immigrants | Mexico | 0.0 /100 | #343 | Tragic 95.8% |
| Salvadorans | 0.0 /100 | #344 | Tragic 95.7% |
| Immigrants | Yemen | 0.0 /100 | #345 | Tragic 95.6% |
| Immigrants | El Salvador | 0.0 /100 | #346 | Tragic 95.5% |
| Spanish American Indians | 0.0 /100 | #347 | Tragic 95.3% |
Demographics Similar to Assyrians/Chaldeans/Syriacs by 3rd Grade
In terms of 3rd grade, the demographic groups most similar to Assyrians/Chaldeans/Syriacs are Immigrants from Senegal (97.4%, a difference of 0.0%), Immigrants from Eastern Africa (97.4%, a difference of 0.0%), Asian (97.4%, a difference of 0.010%), Ethiopian (97.4%, a difference of 0.010%), and South American (97.4%, a difference of 0.010%).
| Demographics | Rating | Rank | 3rd Grade |
| U.S. Virgin Islanders | 1.4 /100 | #240 | Tragic 97.4% |
| Immigrants | Indonesia | 1.4 /100 | #241 | Tragic 97.4% |
| Koreans | 1.3 /100 | #242 | Tragic 97.4% |
| Indians (Asian) | 1.3 /100 | #243 | Tragic 97.4% |
| Asians | 1.1 /100 | #244 | Tragic 97.4% |
| Ethiopians | 1.1 /100 | #245 | Tragic 97.4% |
| Immigrants | Senegal | 1.0 /100 | #246 | Tragic 97.4% |
| Assyrians/Chaldeans/Syriacs | 1.0 /100 | #247 | Tragic 97.4% |
| Immigrants | Eastern Africa | 0.9 /100 | #248 | Tragic 97.4% |
| South Americans | 0.9 /100 | #249 | Tragic 97.4% |
| Immigrants | Middle Africa | 0.9 /100 | #250 | Tragic 97.4% |
| Immigrants | Asia | 0.8 /100 | #251 | Tragic 97.4% |
| Peruvians | 0.8 /100 | #252 | Tragic 97.4% |
| Immigrants | Africa | 0.8 /100 | #253 | Tragic 97.4% |
| Jamaicans | 0.7 /100 | #254 | Tragic 97.4% |