Immigrants from Ghana vs Spaniard Master's Degree
COMPARE
Immigrants from Ghana
Spaniard
Master's Degree
Master's Degree Comparison
Immigrants from Ghana
Spaniards
15.0%
MASTER'S DEGREE
53.6/ 100
METRIC RATING
171st/ 347
METRIC RANK
14.6%
MASTER'S DEGREE
35.8/ 100
METRIC RATING
190th/ 347
METRIC RANK
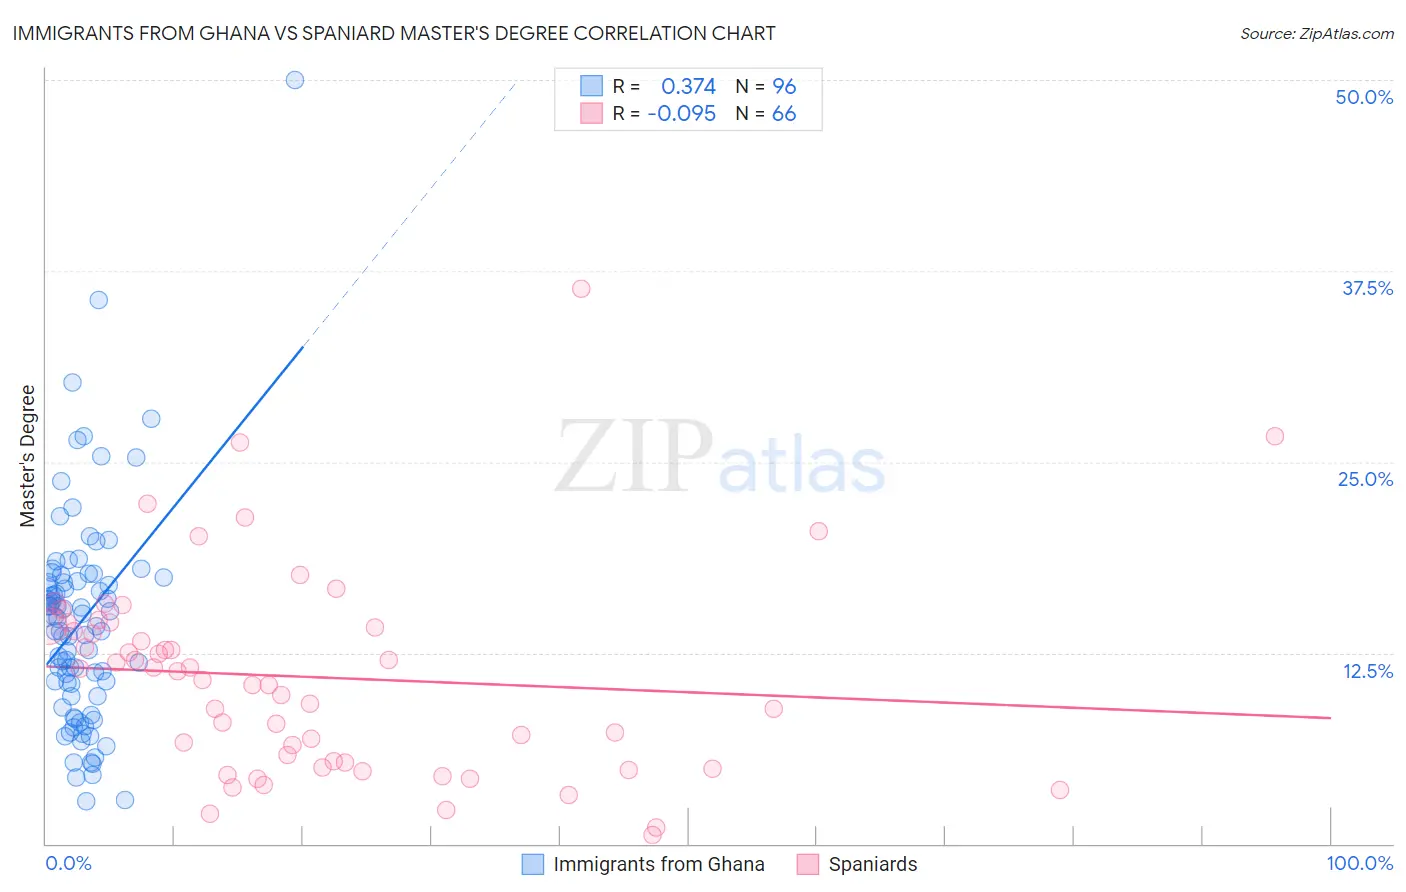
Immigrants from Ghana vs Spaniard Master's Degree Correlation Chart
The statistical analysis conducted on geographies consisting of 199,892,206 people shows a mild positive correlation between the proportion of Immigrants from Ghana and percentage of population with at least master's degree education in the United States with a correlation coefficient (R) of 0.374 and weighted average of 15.0%. Similarly, the statistical analysis conducted on geographies consisting of 443,325,255 people shows a slight negative correlation between the proportion of Spaniards and percentage of population with at least master's degree education in the United States with a correlation coefficient (R) of -0.095 and weighted average of 14.6%, a difference of 2.4%.
Master's Degree Correlation Summary
| Measurement | Immigrants from Ghana | Spaniard |
| Minimum | 2.8% | 0.56% |
| Maximum | 50.0% | 36.4% |
| Range | 47.2% | 35.8% |
| Mean | 14.5% | 10.9% |
| Median | 14.8% | 11.0% |
| Interquartile 25% (IQ1) | 10.1% | 5.3% |
| Interquartile 75% (IQ3) | 17.3% | 14.2% |
| Interquartile Range (IQR) | 7.2% | 8.9% |
| Standard Deviation (Sample) | 7.1% | 6.7% |
| Standard Deviation (Population) | 7.1% | 6.6% |
Demographics Similar to Immigrants from Ghana and Spaniards by Master's Degree
In terms of master's degree, the demographic groups most similar to Immigrants from Ghana are Immigrants from Uruguay (15.0%, a difference of 0.10%), Costa Rican (15.0%, a difference of 0.14%), Irish (15.0%, a difference of 0.35%), Slovak (14.9%, a difference of 0.46%), and Immigrants from Peru (14.9%, a difference of 0.51%). Similarly, the demographic groups most similar to Spaniards are Immigrants (14.6%, a difference of 0.020%), Immigrants from Costa Rica (14.7%, a difference of 0.060%), Basque (14.7%, a difference of 0.10%), Immigrants from Oceania (14.7%, a difference of 0.19%), and Barbadian (14.7%, a difference of 0.35%).
| Demographics | Rating | Rank | Master's Degree |
| Irish | 56.3 /100 | #170 | Average 15.0% |
| Immigrants | Ghana | 53.6 /100 | #171 | Average 15.0% |
| Immigrants | Uruguay | 52.8 /100 | #172 | Average 15.0% |
| Costa Ricans | 52.5 /100 | #173 | Average 15.0% |
| Slovaks | 50.0 /100 | #174 | Average 14.9% |
| Immigrants | Peru | 49.6 /100 | #175 | Average 14.9% |
| Nigerians | 48.6 /100 | #176 | Average 14.9% |
| Immigrants | Colombia | 48.3 /100 | #177 | Average 14.9% |
| English | 45.0 /100 | #178 | Average 14.8% |
| Immigrants | Iraq | 41.3 /100 | #179 | Average 14.8% |
| Celtics | 41.3 /100 | #180 | Average 14.8% |
| Swiss | 41.1 /100 | #181 | Average 14.7% |
| Czechs | 40.4 /100 | #182 | Average 14.7% |
| Sri Lankans | 39.6 /100 | #183 | Fair 14.7% |
| Immigrants | Zaire | 39.5 /100 | #184 | Fair 14.7% |
| Barbadians | 38.3 /100 | #185 | Fair 14.7% |
| Immigrants | Oceania | 37.1 /100 | #186 | Fair 14.7% |
| Basques | 36.5 /100 | #187 | Fair 14.7% |
| Immigrants | Costa Rica | 36.2 /100 | #188 | Fair 14.7% |
| Immigrants | Immigrants | 36.0 /100 | #189 | Fair 14.6% |
| Spaniards | 35.8 /100 | #190 | Fair 14.6% |