Immigrants from Ghana vs Apache Master's Degree

COMPARE

Immigrants from Ghana
Race
Ancestry
AfghanAfricanAlaska NativeAlaskan AthabascanAlbanianAleutAlsatianAmericanArabArapahoArgentineanArmenianAssyrian/Chaldean/SyriacAustralianAustrianBahamianBangladeshiBarbadianBasqueBelgianBelizeanBermudanBhutaneseBlackfeetBolivianBrazilianBritishBritish West IndianBulgarianBurmeseCajunCambodianCanadianCape VerdeanCarpatho RusynCelticCentral AmericanCentral American IndianCherokeeCheyenneChickasawChileanChineseChippewaChoctawColombianColvilleComancheCosta RicanCreeCreekCroatianCrowCubanCypriotCzechCzechoslovakianDanishDelawareDominicanDutchDutch West IndianEastern EuropeanEcuadorianEgyptianEnglishEstonianEthiopianEuropeanFijianFilipinoFinnishFrenchFrench American IndianFrench CanadianGermanGerman RussianGhanaianGreekGuamanian/ChamorroGuatemalanGuyaneseHaitianHmongHonduranHopiHoumaHungarianIcelanderIndian (Asian)IndonesianInupiatIranianIraqiIrishIroquoisIsraeliItalianJamaicanJapaneseJordanianKenyanKiowaKoreanLaotianLatvianLebaneseLiberianLithuanianLumbeeLuxembourgerMacedonianMalaysianMalteseMarshalleseMenomineeMexicanMexican American IndianMongolianMoroccanNative HawaiianNavajoNepaleseNew ZealanderNicaraguanNigerianNorthern EuropeanNorwegianOkinawanOsageOttawaPaiutePakistaniPalestinianPanamanianParaguayanPennsylvania GermanPeruvianPimaPolishPortuguesePotawatomiPuebloPuerto RicanPuget Sound SalishRomanianRussianSalvadoranSamoanScandinavianScotch-IrishScottishSeminoleSenegaleseSerbianShoshoneSierra LeoneanSiouxSlavicSlovakSloveneSomaliSouth AfricanSouth AmericanSouth American IndianSoviet UnionSpaniardSpanishSpanish AmericanSpanish American IndianSri LankanSubsaharan AfricanSudaneseSwedishSwissSyrianTaiwaneseThaiTlingit-HaidaTohono O'OdhamTonganTrinidadian and TobagonianTsimshianTurkishU.S. Virgin IslanderUgandanUkrainianUruguayanUteVenezuelanVietnameseWelshWest IndianYakamaYaquiYugoslavianYumanYup'ikZimbabwean
Immigration
NonimmigrantsImmigrantsAfghanistanAfricaAlbaniaArgentinaArmeniaAsiaAustraliaAustriaBahamasBangladeshBarbadosBelarusBelgiumBelizeBoliviaBosnia and HerzegovinaBrazilBulgariaBurma/MyanmarCabo VerdeCambodiaCameroonCanadaCaribbeanCentral AmericaChileChinaColombiaCongoCosta RicaCroatiaCubaCzechoslovakiaDenmarkDominicaDominican RepublicEastern AfricaEastern AsiaEastern EuropeEcuadorEgyptEl SalvadorEnglandEritreaEthiopiaEuropeFijiFranceGermanyGhanaGreeceGrenadaGuatemalaGuyanaHaitiHondurasHong KongHungaryIndiaIndonesiaIranIraqIrelandIsraelItalyJamaicaJapanJordanKazakhstanKenyaKoreaKuwaitLaosLatin AmericaLatviaLebanonLiberiaLithuaniaMalaysiaMexicoMicronesiaMiddle AfricaMoldovaMoroccoNepalNetherlandsNicaraguaNigeriaNorth AmericaNorth MacedoniaNorthern AfricaNorthern EuropeNorwayOceaniaPakistanPanamaPeruPhilippinesPolandPortugalRomaniaRussiaSaudi ArabiaScotlandSenegalSerbiaSierra LeoneSingaporeSomaliaSouth AfricaSouth AmericaSouth Central AsiaSouth Eastern AsiaSouthern EuropeSpainSri LankaSt. Vincent and the GrenadinesSudanSwedenSwitzerlandSyriaTaiwanThailandTrinidad and TobagoTurkeyUgandaUkraineUruguayUzbekistanVenezuelaVietnamWest IndiesWestern AfricaWestern AsiaWestern EuropeYemenZaireZimbabweAzores
Apache
Race
Ancestry
AfghanAfricanAlaska NativeAlaskan AthabascanAlbanianAleutAlsatianAmericanApacheArabArapahoArgentineanArmenianAssyrian/Chaldean/SyriacAustralianAustrianBahamianBangladeshiBarbadianBasqueBelgianBelizeanBermudanBhutaneseBlackfeetBolivianBrazilianBritishBritish West IndianBulgarianBurmeseCajunCambodianCanadianCape VerdeanCarpatho RusynCelticCentral AmericanCentral American IndianCherokeeCheyenneChickasawChileanChineseChippewaChoctawColombianColvilleComancheCosta RicanCreeCreekCroatianCrowCubanCypriotCzechCzechoslovakianDanishDelawareDominicanDutchDutch West IndianEastern EuropeanEcuadorianEgyptianEnglishEstonianEthiopianEuropeanFijianFilipinoFinnishFrenchFrench American IndianFrench CanadianGermanGerman RussianGhanaianGreekGuamanian/ChamorroGuatemalanGuyaneseHaitianHmongHonduranHopiHoumaHungarianIcelanderIndian (Asian)IndonesianInupiatIranianIraqiIrishIroquoisIsraeliItalianJamaicanJapaneseJordanianKenyanKiowaKoreanLaotianLatvianLebaneseLiberianLithuanianLumbeeLuxembourgerMacedonianMalaysianMalteseMarshalleseMenomineeMexicanMexican American IndianMongolianMoroccanNative HawaiianNavajoNepaleseNew ZealanderNicaraguanNigerianNorthern EuropeanNorwegianOkinawanOsageOttawaPaiutePakistaniPalestinianPanamanianParaguayanPennsylvania GermanPeruvianPimaPolishPortuguesePotawatomiPuebloPuerto RicanPuget Sound SalishRomanianRussianSalvadoranSamoanScandinavianScotch-IrishScottishSeminoleSenegaleseSerbianShoshoneSierra LeoneanSiouxSlavicSlovakSloveneSomaliSouth AfricanSouth AmericanSouth American IndianSoviet UnionSpaniardSpanishSpanish AmericanSpanish American IndianSri LankanSubsaharan AfricanSudaneseSwedishSwissSyrianTaiwaneseThaiTlingit-HaidaTohono O'OdhamTonganTrinidadian and TobagonianTsimshianTurkishU.S. Virgin IslanderUgandanUkrainianUruguayanUteVenezuelanVietnameseWelshWest IndianYakamaYaquiYugoslavianYumanYup'ikZimbabwean
Immigration
NonimmigrantsImmigrantsAfghanistanAfricaAlbaniaArgentinaArmeniaAsiaAustraliaAustriaBahamasBangladeshBarbadosBelarusBelgiumBelizeBoliviaBosnia and HerzegovinaBrazilBulgariaBurma/MyanmarCabo VerdeCambodiaCameroonCanadaCaribbeanCentral AmericaChileChinaColombiaCongoCosta RicaCroatiaCubaCzechoslovakiaDenmarkDominicaDominican RepublicEastern AfricaEastern AsiaEastern EuropeEcuadorEgyptEl SalvadorEnglandEritreaEthiopiaEuropeFijiFranceGermanyGreeceGrenadaGuatemalaGuyanaHaitiHondurasHong KongHungaryIndiaIndonesiaIranIraqIrelandIsraelItalyJamaicaJapanJordanKazakhstanKenyaKoreaKuwaitLaosLatin AmericaLatviaLebanonLiberiaLithuaniaMalaysiaMexicoMicronesiaMiddle AfricaMoldovaMoroccoNepalNetherlandsNicaraguaNigeriaNorth AmericaNorth MacedoniaNorthern AfricaNorthern EuropeNorwayOceaniaPakistanPanamaPeruPhilippinesPolandPortugalRomaniaRussiaSaudi ArabiaScotlandSenegalSerbiaSierra LeoneSingaporeSomaliaSouth AfricaSouth AmericaSouth Central AsiaSouth Eastern AsiaSouthern EuropeSpainSri LankaSt. Vincent and the GrenadinesSudanSwedenSwitzerlandSyriaTaiwanThailandTrinidad and TobagoTurkeyUgandaUkraineUruguayUzbekistanVenezuelaVietnamWest IndiesWestern AfricaWestern AsiaWestern EuropeYemenZaireZimbabweAzores
Master's Degree
Income
Poverty
Unemployment
Labor Participation
Family Structure
Vehicle Availability
Education Level
Disability

Master's Degree Comparison

Immigrants from Ghana

Apache

Average
Tragic
15.0%
MASTER'S DEGREE
53.6/ 100
METRIC RATING
171st/ 347
METRIC RANK
11.0%
MASTER'S DEGREE
0.0/ 100
METRIC RATING
315th/ 347
METRIC RANK

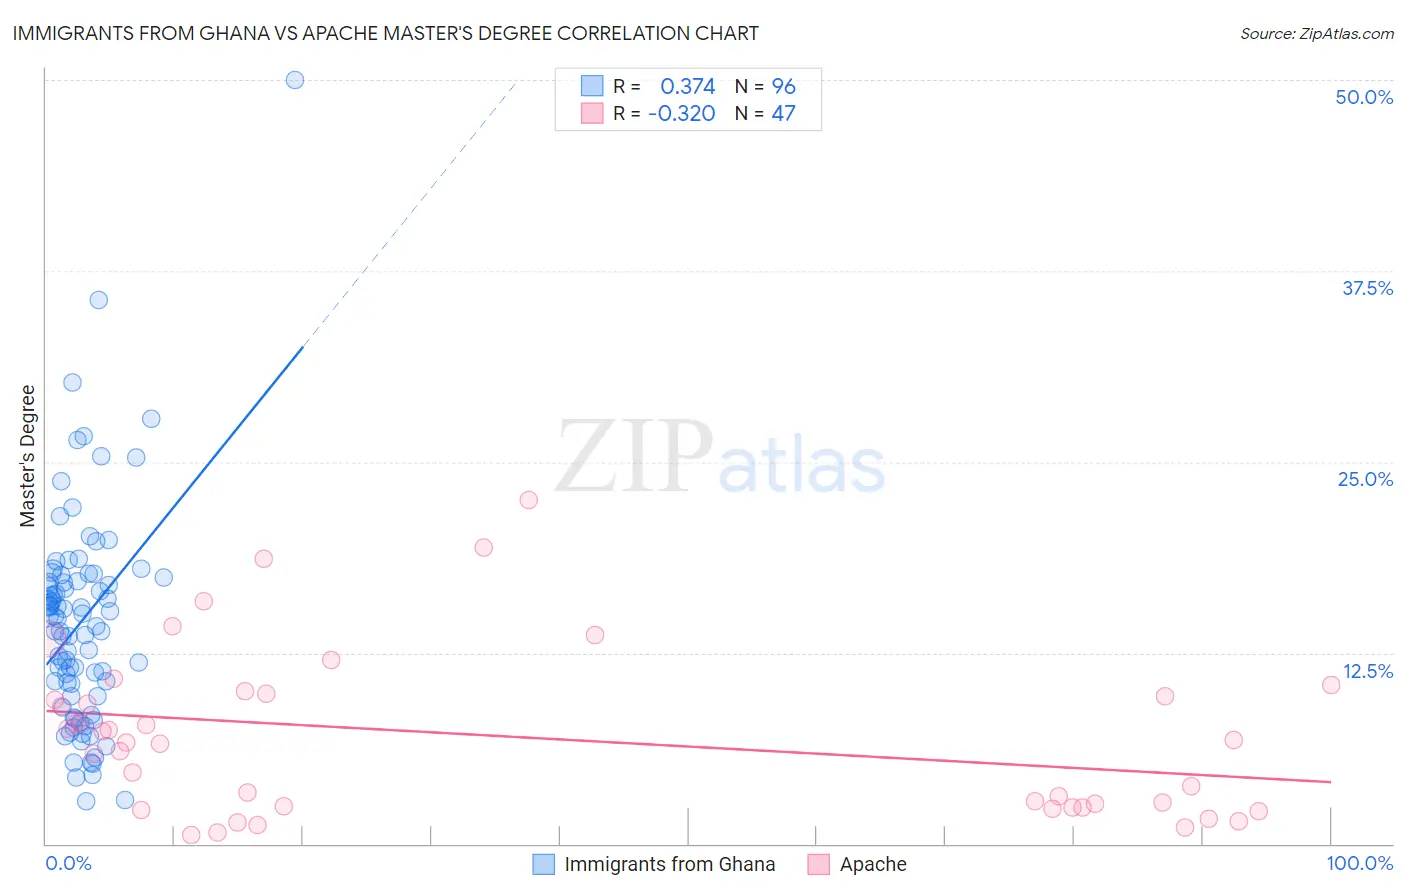
Immigrants from Ghana vs Apache Master's Degree Correlation Chart

The statistical analysis conducted on geographies consisting of 199,892,206 people shows a mild positive correlation between the proportion of Immigrants from Ghana and percentage of population with at least master's degree education in the United States with a correlation coefficient (R) of 0.374 and weighted average of 15.0%. Similarly, the statistical analysis conducted on geographies consisting of 231,057,413 people shows a mild negative correlation between the proportion of Apache and percentage of population with at least master's degree education in the United States with a correlation coefficient (R) of -0.320 and weighted average of 11.0%, a difference of 36.7%.
Immigrants from Ghana vs Apache Master's Degree

Master's Degree Correlation Summary

MeasurementImmigrants from GhanaApache
Minimum2.8%0.59%
Maximum50.0%22.5%
Range47.2%21.9%
Mean14.5%7.0%
Median14.8%6.7%
Interquartile 25% (IQ1)10.1%2.3%
Interquartile 75% (IQ3)17.3%9.8%
Interquartile Range (IQR)7.2%7.4%
Standard Deviation (Sample)7.1%5.3%
Standard Deviation (Population)7.1%5.3%

Similar Demographics by Master's Degree

Demographics Similar to Immigrants from Ghana by Master's Degree

In terms of master's degree, the demographic groups most similar to Immigrants from Ghana are Immigrants from Uruguay (15.0%, a difference of 0.10%), Costa Rican (15.0%, a difference of 0.14%), Irish (15.0%, a difference of 0.35%), Slovak (14.9%, a difference of 0.46%), and Immigrants from Peru (14.9%, a difference of 0.51%).
DemographicsRating | RankMaster's Degree
Colombians
66.9
/100
|
#164
Good
15.3%
Immigrants | Kenya
66.6
/100
|
#165
Good
15.3%
Swedes
66.1
/100
|
#166
Good
15.2%
Senegalese
65.6
/100
|
#167
Good
15.2%
Immigrants | North Macedonia
64.5
/100
|
#168
Good
15.2%
Scottish
62.7
/100
|
#169
Good
15.2%
Irish
56.3
/100
|
#170
Average
15.0%
Immigrants | Ghana
53.6
/100
|
#171
Average
15.0%
Immigrants | Uruguay
52.8
/100
|
#172
Average
15.0%
Costa Ricans
52.5
/100
|
#173
Average
15.0%
Slovaks
50.0
/100
|
#174
Average
14.9%
Immigrants | Peru
49.6
/100
|
#175
Average
14.9%
Nigerians
48.6
/100
|
#176
Average
14.9%
Immigrants | Colombia
48.3
/100
|
#177
Average
14.9%
English
45.0
/100
|
#178
Average
14.8%

Demographics Similar to Apache by Master's Degree

In terms of master's degree, the demographic groups most similar to Apache are Cajun (11.0%, a difference of 0.0%), Hispanic or Latino (10.9%, a difference of 0.34%), Yaqui (11.0%, a difference of 0.40%), Choctaw (11.0%, a difference of 0.58%), and Seminole (11.0%, a difference of 0.67%).
DemographicsRating | RankMaster's Degree
Puerto Ricans
0.0
/100
|
#308
Tragic
11.2%
Puget Sound Salish
0.0
/100
|
#309
Tragic
11.1%
Shoshone
0.0
/100
|
#310
Tragic
11.1%
Seminole
0.0
/100
|
#311
Tragic
11.0%
Choctaw
0.0
/100
|
#312
Tragic
11.0%
Yaqui
0.0
/100
|
#313
Tragic
11.0%
Cajuns
0.0
/100
|
#314
Tragic
11.0%
Apache
0.0
/100
|
#315
Tragic
11.0%
Hispanics or Latinos
0.0
/100
|
#316
Tragic
10.9%
Hopi
0.0
/100
|
#317
Tragic
10.9%
Immigrants | Cuba
0.0
/100
|
#318
Tragic
10.9%
Kiowa
0.0
/100
|
#319
Tragic
10.8%
Immigrants | Micronesia
0.0
/100
|
#320
Tragic
10.8%
Pennsylvania Germans
0.0
/100
|
#321
Tragic
10.7%
Sioux
0.0
/100
|
#322
Tragic
10.7%