Puerto Rican vs Spaniard Master's Degree
COMPARE
Puerto Rican
Spaniard
Master's Degree
Master's Degree Comparison
Puerto Ricans
Spaniards
11.2%
MASTER'S DEGREE
0.0/ 100
METRIC RATING
308th/ 347
METRIC RANK
14.6%
MASTER'S DEGREE
35.8/ 100
METRIC RATING
190th/ 347
METRIC RANK
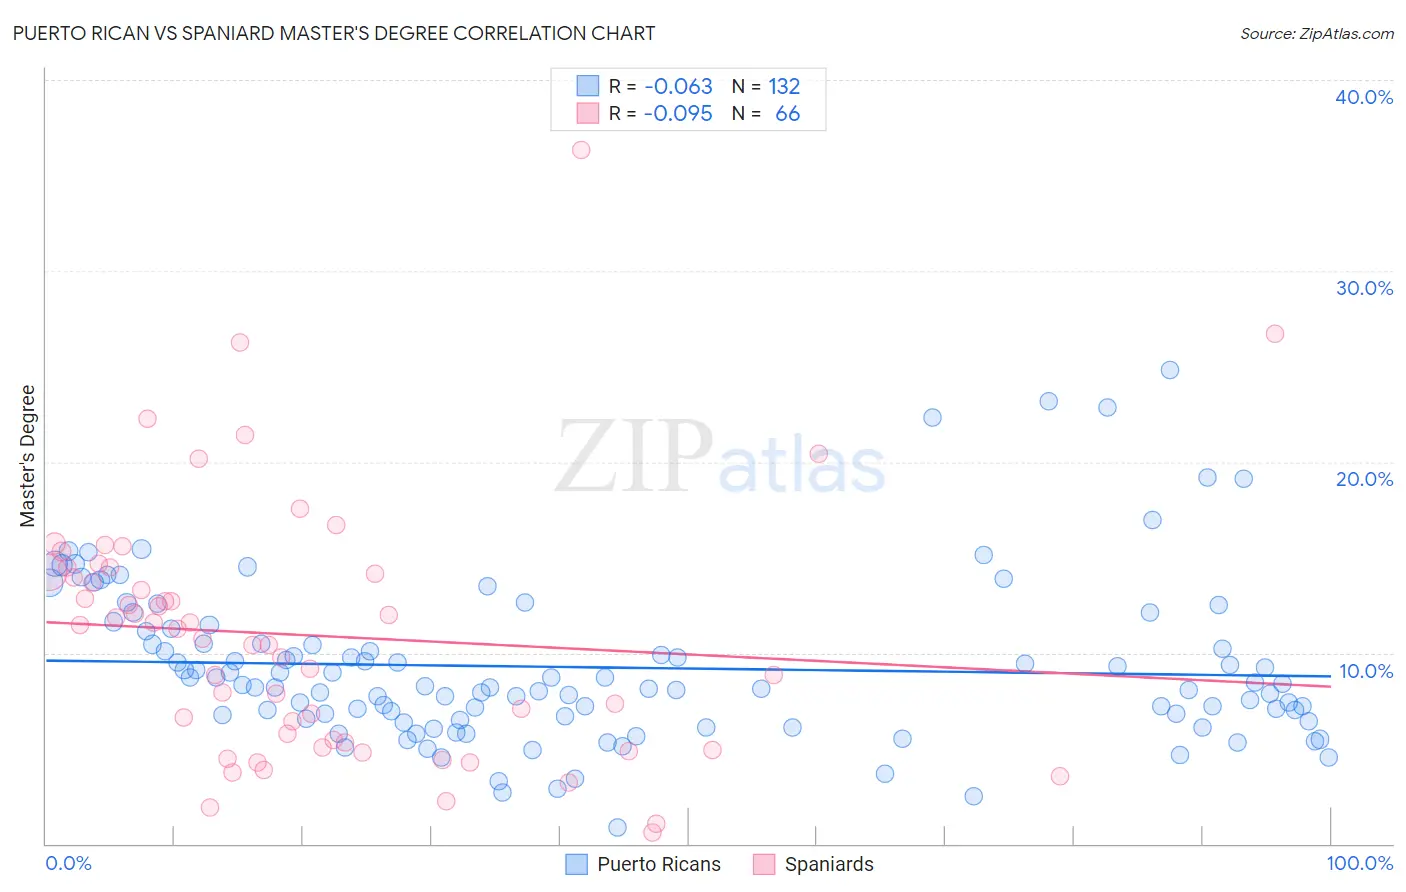
Puerto Rican vs Spaniard Master's Degree Correlation Chart
The statistical analysis conducted on geographies consisting of 527,764,929 people shows a slight negative correlation between the proportion of Puerto Ricans and percentage of population with at least master's degree education in the United States with a correlation coefficient (R) of -0.063 and weighted average of 11.2%. Similarly, the statistical analysis conducted on geographies consisting of 443,325,255 people shows a slight negative correlation between the proportion of Spaniards and percentage of population with at least master's degree education in the United States with a correlation coefficient (R) of -0.095 and weighted average of 14.6%, a difference of 31.1%.
Master's Degree Correlation Summary
| Measurement | Puerto Rican | Spaniard |
| Minimum | 0.86% | 0.56% |
| Maximum | 24.8% | 36.4% |
| Range | 23.9% | 35.8% |
| Mean | 9.2% | 10.9% |
| Median | 8.2% | 11.0% |
| Interquartile 25% (IQ1) | 6.6% | 5.3% |
| Interquartile 75% (IQ3) | 10.8% | 14.2% |
| Interquartile Range (IQR) | 4.2% | 8.9% |
| Standard Deviation (Sample) | 4.2% | 6.7% |
| Standard Deviation (Population) | 4.2% | 6.6% |
Similar Demographics by Master's Degree
Demographics Similar to Puerto Ricans by Master's Degree
In terms of master's degree, the demographic groups most similar to Puerto Ricans are Puget Sound Salish (11.1%, a difference of 0.29%), Cheyenne (11.2%, a difference of 0.55%), Shoshone (11.1%, a difference of 0.65%), Mexican American Indian (11.2%, a difference of 0.70%), and Immigrants from Latin America (11.3%, a difference of 0.89%).
| Demographics | Rating | Rank | Master's Degree |
| Tsimshian | 0.1 /100 | #301 | Tragic 11.4% |
| Cherokee | 0.1 /100 | #302 | Tragic 11.4% |
| Immigrants | Laos | 0.1 /100 | #303 | Tragic 11.4% |
| Immigrants | Cabo Verde | 0.1 /100 | #304 | Tragic 11.3% |
| Immigrants | Latin America | 0.0 /100 | #305 | Tragic 11.3% |
| Mexican American Indians | 0.0 /100 | #306 | Tragic 11.2% |
| Cheyenne | 0.0 /100 | #307 | Tragic 11.2% |
| Puerto Ricans | 0.0 /100 | #308 | Tragic 11.2% |
| Puget Sound Salish | 0.0 /100 | #309 | Tragic 11.1% |
| Shoshone | 0.0 /100 | #310 | Tragic 11.1% |
| Seminole | 0.0 /100 | #311 | Tragic 11.0% |
| Choctaw | 0.0 /100 | #312 | Tragic 11.0% |
| Yaqui | 0.0 /100 | #313 | Tragic 11.0% |
| Cajuns | 0.0 /100 | #314 | Tragic 11.0% |
| Apache | 0.0 /100 | #315 | Tragic 11.0% |
Demographics Similar to Spaniards by Master's Degree
In terms of master's degree, the demographic groups most similar to Spaniards are Immigrants (14.6%, a difference of 0.020%), Immigrants from Costa Rica (14.7%, a difference of 0.060%), Basque (14.7%, a difference of 0.10%), Immigrants from Oceania (14.7%, a difference of 0.19%), and Welsh (14.6%, a difference of 0.23%).
| Demographics | Rating | Rank | Master's Degree |
| Sri Lankans | 39.6 /100 | #183 | Fair 14.7% |
| Immigrants | Zaire | 39.5 /100 | #184 | Fair 14.7% |
| Barbadians | 38.3 /100 | #185 | Fair 14.7% |
| Immigrants | Oceania | 37.1 /100 | #186 | Fair 14.7% |
| Basques | 36.5 /100 | #187 | Fair 14.7% |
| Immigrants | Costa Rica | 36.2 /100 | #188 | Fair 14.7% |
| Immigrants | Immigrants | 36.0 /100 | #189 | Fair 14.6% |
| Spaniards | 35.8 /100 | #190 | Fair 14.6% |
| Welsh | 34.2 /100 | #191 | Fair 14.6% |
| Immigrants | Middle Africa | 33.6 /100 | #192 | Fair 14.6% |
| Immigrants | Nigeria | 32.7 /100 | #193 | Fair 14.6% |
| Chinese | 32.5 /100 | #194 | Fair 14.6% |
| Danes | 31.3 /100 | #195 | Fair 14.5% |
| Czechoslovakians | 29.9 /100 | #196 | Fair 14.5% |
| Belgians | 28.0 /100 | #197 | Fair 14.5% |