Immigrants from Ghana vs Spaniard No Vehicles in Household
COMPARE
Immigrants from Ghana
Spaniard
No Vehicles in Household
No Vehicles in Household Comparison
Immigrants from Ghana
Spaniards
16.6%
NO VEHICLES IN HOUSEHOLD
0.0/ 100
METRIC RATING
317th/ 347
METRIC RANK
8.4%
NO VEHICLES IN HOUSEHOLD
99.7/ 100
METRIC RATING
69th/ 347
METRIC RANK
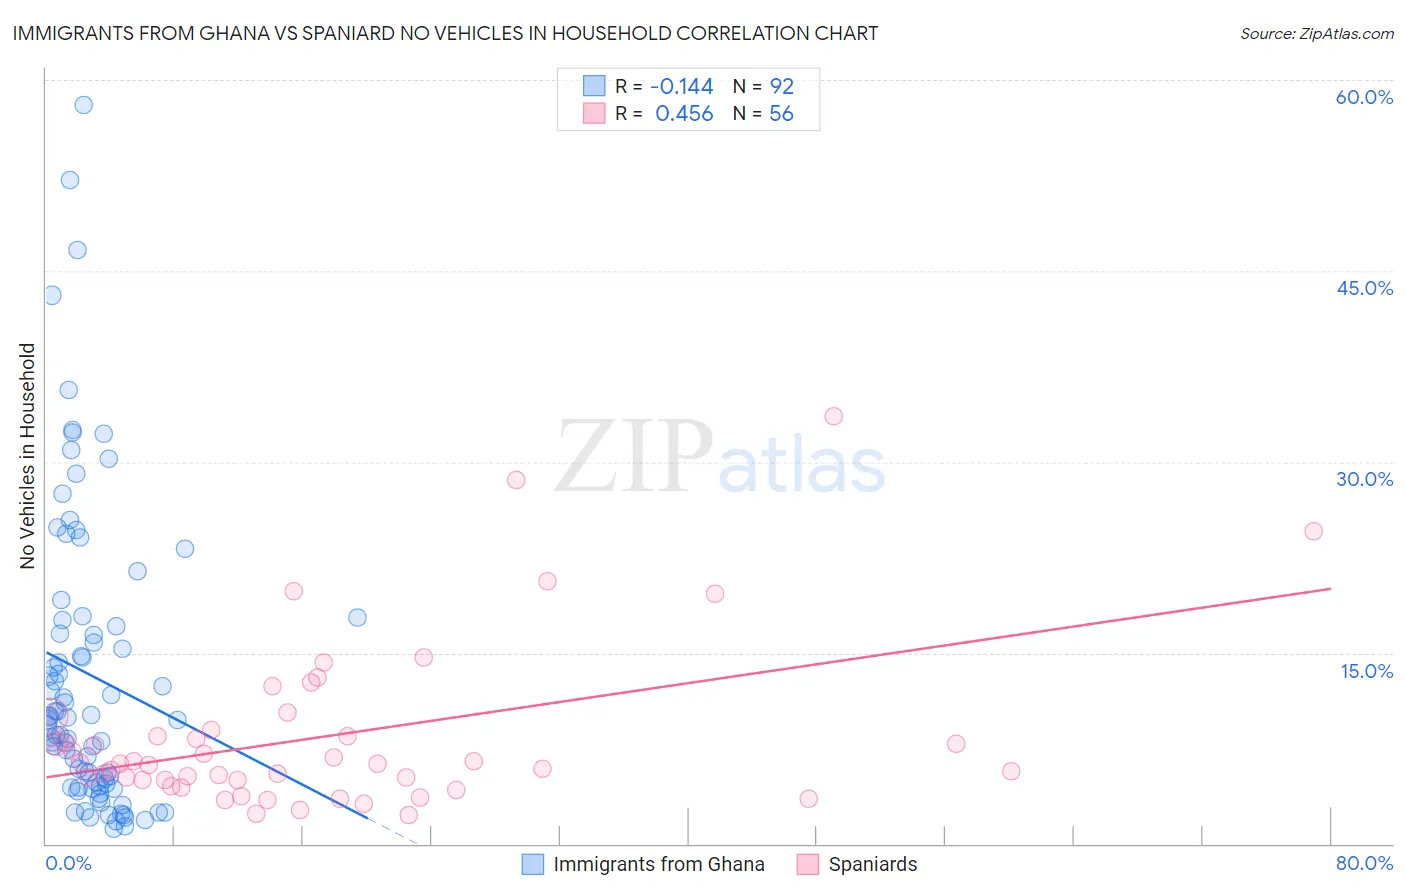
Immigrants from Ghana vs Spaniard No Vehicles in Household Correlation Chart
The statistical analysis conducted on geographies consisting of 199,471,025 people shows a poor negative correlation between the proportion of Immigrants from Ghana and percentage of households with no vehicle available in the United States with a correlation coefficient (R) of -0.144 and weighted average of 16.6%. Similarly, the statistical analysis conducted on geographies consisting of 441,901,498 people shows a moderate positive correlation between the proportion of Spaniards and percentage of households with no vehicle available in the United States with a correlation coefficient (R) of 0.456 and weighted average of 8.4%, a difference of 98.4%.
No Vehicles in Household Correlation Summary
| Measurement | Immigrants from Ghana | Spaniard |
| Minimum | 1.2% | 2.2% |
| Maximum | 58.0% | 33.6% |
| Range | 56.8% | 31.3% |
| Mean | 13.3% | 8.5% |
| Median | 9.8% | 6.3% |
| Interquartile 25% (IQ1) | 4.6% | 5.0% |
| Interquartile 75% (IQ3) | 17.3% | 8.7% |
| Interquartile Range (IQR) | 12.7% | 3.7% |
| Standard Deviation (Sample) | 11.8% | 6.5% |
| Standard Deviation (Population) | 11.7% | 6.4% |
Similar Demographics by No Vehicles in Household
Demographics Similar to Immigrants from Ghana by No Vehicles in Household
In terms of no vehicles in household, the demographic groups most similar to Immigrants from Ghana are Immigrants from Belarus (16.7%, a difference of 0.86%), Ghanaian (16.4%, a difference of 0.95%), Alaska Native (17.4%, a difference of 4.8%), Soviet Union (17.4%, a difference of 5.0%), and Cypriot (15.7%, a difference of 6.0%).
| Demographics | Rating | Rank | No Vehicles in Household |
| Cape Verdeans | 0.0 /100 | #310 | Tragic 15.6% |
| Immigrants | Israel | 0.0 /100 | #311 | Tragic 15.6% |
| Alaskan Athabascans | 0.0 /100 | #312 | Tragic 15.6% |
| Tohono O'odham | 0.0 /100 | #313 | Tragic 15.6% |
| Albanians | 0.0 /100 | #314 | Tragic 15.6% |
| Cypriots | 0.0 /100 | #315 | Tragic 15.7% |
| Ghanaians | 0.0 /100 | #316 | Tragic 16.4% |
| Immigrants | Ghana | 0.0 /100 | #317 | Tragic 16.6% |
| Immigrants | Belarus | 0.0 /100 | #318 | Tragic 16.7% |
| Alaska Natives | 0.0 /100 | #319 | Tragic 17.4% |
| Soviet Union | 0.0 /100 | #320 | Tragic 17.4% |
| Jamaicans | 0.0 /100 | #321 | Tragic 17.9% |
| Immigrants | Cabo Verde | 0.0 /100 | #322 | Tragic 18.4% |
| Immigrants | Yemen | 0.0 /100 | #323 | Tragic 19.5% |
| Immigrants | Caribbean | 0.0 /100 | #324 | Tragic 19.6% |
Demographics Similar to Spaniards by No Vehicles in Household
In terms of no vehicles in household, the demographic groups most similar to Spaniards are Immigrants from Iran (8.4%, a difference of 0.050%), Immigrants from Scotland (8.3%, a difference of 0.45%), Palestinian (8.3%, a difference of 0.46%), Canadian (8.3%, a difference of 0.57%), and Cajun (8.4%, a difference of 0.72%).
| Demographics | Rating | Rank | No Vehicles in Household |
| Chinese | 99.8 /100 | #62 | Exceptional 8.2% |
| Slovaks | 99.8 /100 | #63 | Exceptional 8.3% |
| Croatians | 99.8 /100 | #64 | Exceptional 8.3% |
| Canadians | 99.7 /100 | #65 | Exceptional 8.3% |
| Palestinians | 99.7 /100 | #66 | Exceptional 8.3% |
| Immigrants | Scotland | 99.7 /100 | #67 | Exceptional 8.3% |
| Immigrants | Iran | 99.7 /100 | #68 | Exceptional 8.4% |
| Spaniards | 99.7 /100 | #69 | Exceptional 8.4% |
| Cajuns | 99.6 /100 | #70 | Exceptional 8.4% |
| Immigrants | Lebanon | 99.6 /100 | #71 | Exceptional 8.4% |
| Lithuanians | 99.6 /100 | #72 | Exceptional 8.4% |
| Poles | 99.6 /100 | #73 | Exceptional 8.4% |
| Cubans | 99.5 /100 | #74 | Exceptional 8.5% |
| Jordanians | 99.5 /100 | #75 | Exceptional 8.5% |
| Immigrants | Philippines | 99.5 /100 | #76 | Exceptional 8.5% |