Immigrants from Ghana vs Nicaraguan Master's Degree
COMPARE
Immigrants from Ghana
Nicaraguan
Master's Degree
Master's Degree Comparison
Immigrants from Ghana
Nicaraguans
15.0%
MASTER'S DEGREE
53.6/ 100
METRIC RATING
171st/ 347
METRIC RANK
12.5%
MASTER'S DEGREE
0.6/ 100
METRIC RATING
262nd/ 347
METRIC RANK
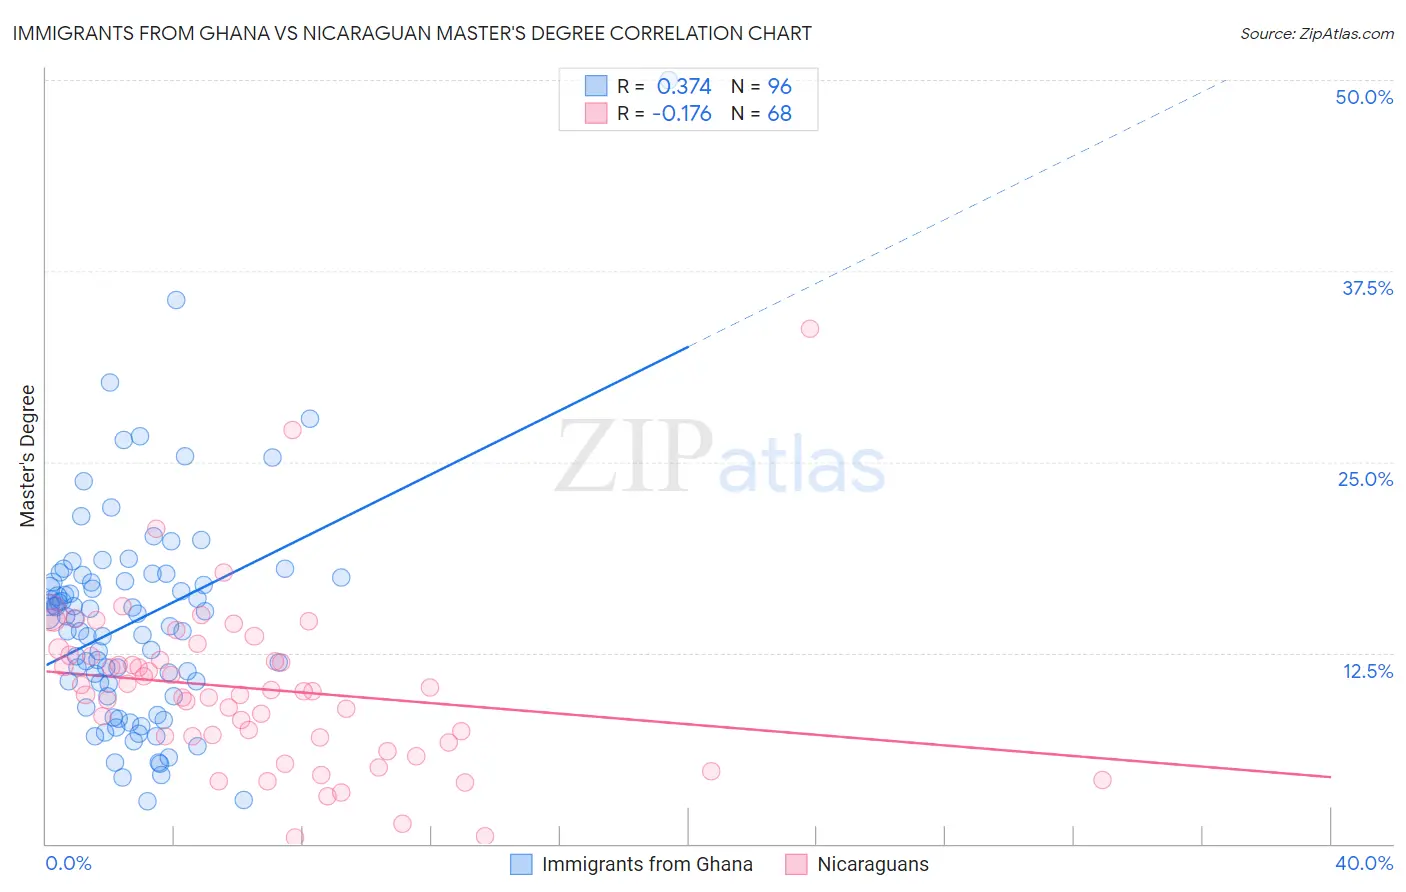
Immigrants from Ghana vs Nicaraguan Master's Degree Correlation Chart
The statistical analysis conducted on geographies consisting of 199,892,206 people shows a mild positive correlation between the proportion of Immigrants from Ghana and percentage of population with at least master's degree education in the United States with a correlation coefficient (R) of 0.374 and weighted average of 15.0%. Similarly, the statistical analysis conducted on geographies consisting of 285,672,078 people shows a poor negative correlation between the proportion of Nicaraguans and percentage of population with at least master's degree education in the United States with a correlation coefficient (R) of -0.176 and weighted average of 12.5%, a difference of 20.2%.
Master's Degree Correlation Summary
| Measurement | Immigrants from Ghana | Nicaraguan |
| Minimum | 2.8% | 0.42% |
| Maximum | 50.0% | 33.7% |
| Range | 47.2% | 33.3% |
| Mean | 14.5% | 10.2% |
| Median | 14.8% | 10.0% |
| Interquartile 25% (IQ1) | 10.1% | 7.0% |
| Interquartile 75% (IQ3) | 17.3% | 12.3% |
| Interquartile Range (IQR) | 7.2% | 5.4% |
| Standard Deviation (Sample) | 7.1% | 5.5% |
| Standard Deviation (Population) | 7.1% | 5.4% |
Similar Demographics by Master's Degree
Demographics Similar to Immigrants from Ghana by Master's Degree
In terms of master's degree, the demographic groups most similar to Immigrants from Ghana are Immigrants from Uruguay (15.0%, a difference of 0.10%), Costa Rican (15.0%, a difference of 0.14%), Irish (15.0%, a difference of 0.35%), Slovak (14.9%, a difference of 0.46%), and Immigrants from Peru (14.9%, a difference of 0.51%).
| Demographics | Rating | Rank | Master's Degree |
| Colombians | 66.9 /100 | #164 | Good 15.3% |
| Immigrants | Kenya | 66.6 /100 | #165 | Good 15.3% |
| Swedes | 66.1 /100 | #166 | Good 15.2% |
| Senegalese | 65.6 /100 | #167 | Good 15.2% |
| Immigrants | North Macedonia | 64.5 /100 | #168 | Good 15.2% |
| Scottish | 62.7 /100 | #169 | Good 15.2% |
| Irish | 56.3 /100 | #170 | Average 15.0% |
| Immigrants | Ghana | 53.6 /100 | #171 | Average 15.0% |
| Immigrants | Uruguay | 52.8 /100 | #172 | Average 15.0% |
| Costa Ricans | 52.5 /100 | #173 | Average 15.0% |
| Slovaks | 50.0 /100 | #174 | Average 14.9% |
| Immigrants | Peru | 49.6 /100 | #175 | Average 14.9% |
| Nigerians | 48.6 /100 | #176 | Average 14.9% |
| Immigrants | Colombia | 48.3 /100 | #177 | Average 14.9% |
| English | 45.0 /100 | #178 | Average 14.8% |
Demographics Similar to Nicaraguans by Master's Degree
In terms of master's degree, the demographic groups most similar to Nicaraguans are Tongan (12.5%, a difference of 0.18%), Dominican (12.5%, a difference of 0.22%), Japanese (12.5%, a difference of 0.23%), Central American Indian (12.4%, a difference of 0.23%), and Immigrants from Liberia (12.5%, a difference of 0.32%).
| Demographics | Rating | Rank | Master's Degree |
| Immigrants | Congo | 0.8 /100 | #255 | Tragic 12.6% |
| Immigrants | Portugal | 0.8 /100 | #256 | Tragic 12.6% |
| Osage | 0.7 /100 | #257 | Tragic 12.6% |
| Immigrants | Liberia | 0.6 /100 | #258 | Tragic 12.5% |
| Japanese | 0.6 /100 | #259 | Tragic 12.5% |
| Dominicans | 0.6 /100 | #260 | Tragic 12.5% |
| Tongans | 0.6 /100 | #261 | Tragic 12.5% |
| Nicaraguans | 0.6 /100 | #262 | Tragic 12.5% |
| Central American Indians | 0.5 /100 | #263 | Tragic 12.4% |
| Belizeans | 0.5 /100 | #264 | Tragic 12.4% |
| Immigrants | Fiji | 0.5 /100 | #265 | Tragic 12.4% |
| Bahamians | 0.5 /100 | #266 | Tragic 12.4% |
| Americans | 0.4 /100 | #267 | Tragic 12.3% |
| Native Hawaiians | 0.4 /100 | #268 | Tragic 12.3% |
| Central Americans | 0.3 /100 | #269 | Tragic 12.2% |