Indian (Asian) vs Spaniard Master's Degree
COMPARE
Indian (Asian)
Spaniard
Master's Degree
Master's Degree Comparison
Indians (Asian)
Spaniards
20.5%
MASTER'S DEGREE
100.0/ 100
METRIC RATING
20th/ 347
METRIC RANK
14.6%
MASTER'S DEGREE
35.8/ 100
METRIC RATING
190th/ 347
METRIC RANK
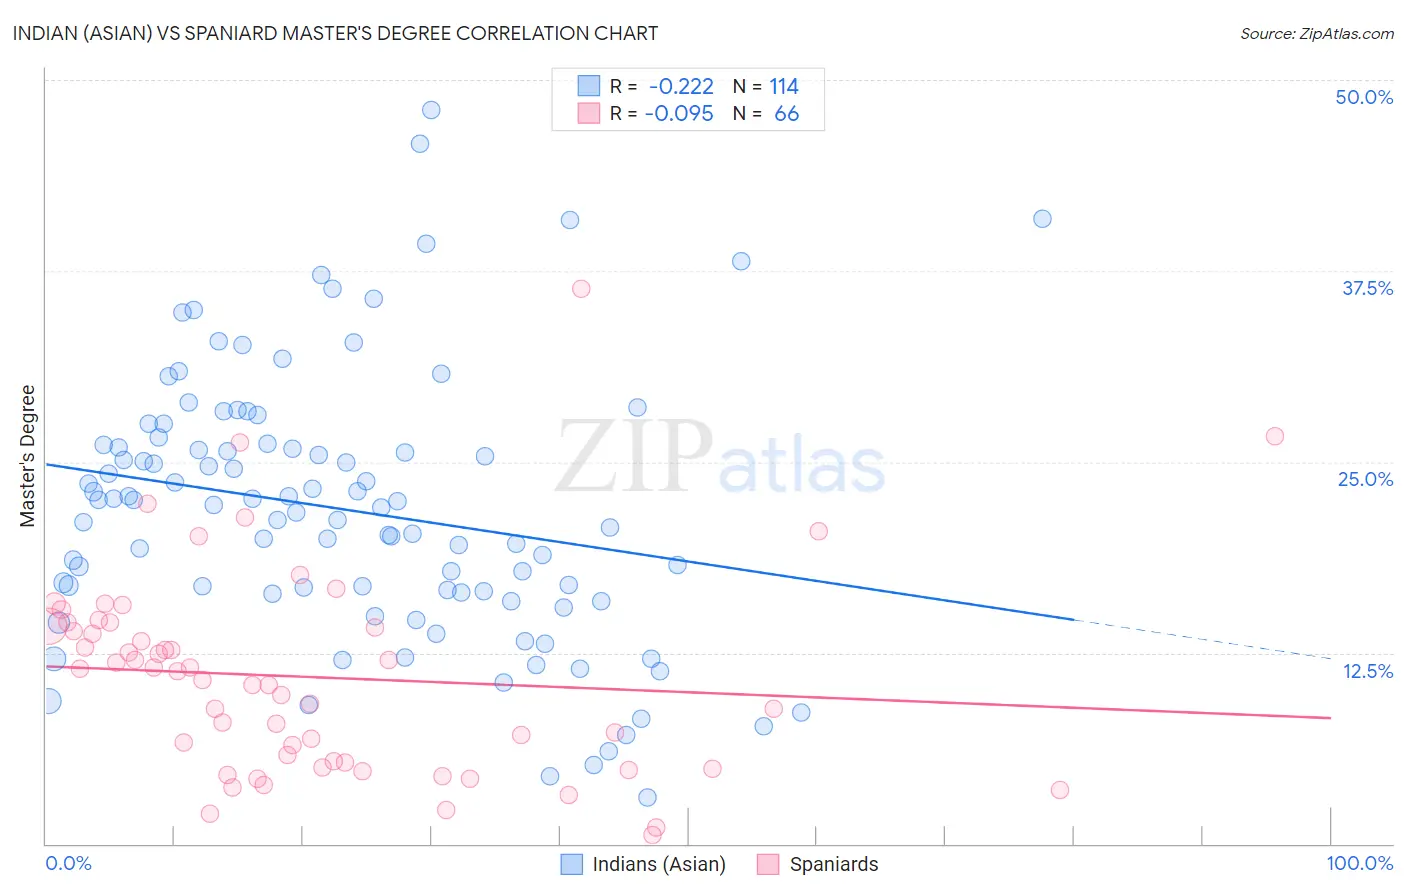
Indian (Asian) vs Spaniard Master's Degree Correlation Chart
The statistical analysis conducted on geographies consisting of 495,020,045 people shows a weak negative correlation between the proportion of Indians (Asian) and percentage of population with at least master's degree education in the United States with a correlation coefficient (R) of -0.222 and weighted average of 20.5%. Similarly, the statistical analysis conducted on geographies consisting of 443,325,255 people shows a slight negative correlation between the proportion of Spaniards and percentage of population with at least master's degree education in the United States with a correlation coefficient (R) of -0.095 and weighted average of 14.6%, a difference of 39.7%.
Master's Degree Correlation Summary
| Measurement | Indian (Asian) | Spaniard |
| Minimum | 3.0% | 0.56% |
| Maximum | 48.0% | 36.4% |
| Range | 45.0% | 35.8% |
| Mean | 21.8% | 10.9% |
| Median | 22.1% | 11.0% |
| Interquartile 25% (IQ1) | 16.5% | 5.3% |
| Interquartile 75% (IQ3) | 26.1% | 14.2% |
| Interquartile Range (IQR) | 9.6% | 8.9% |
| Standard Deviation (Sample) | 8.8% | 6.7% |
| Standard Deviation (Population) | 8.8% | 6.6% |
Similar Demographics by Master's Degree
Demographics Similar to Indians (Asian) by Master's Degree
In terms of master's degree, the demographic groups most similar to Indians (Asian) are Immigrants from Hong Kong (20.5%, a difference of 0.020%), Immigrants from Ireland (20.4%, a difference of 0.11%), Soviet Union (20.5%, a difference of 0.37%), Israeli (20.3%, a difference of 0.53%), and Immigrants from France (20.3%, a difference of 0.81%).
| Demographics | Rating | Rank | Master's Degree |
| Immigrants | Australia | 100.0 /100 | #13 | Exceptional 20.9% |
| Immigrants | Switzerland | 100.0 /100 | #14 | Exceptional 20.9% |
| Immigrants | Eastern Asia | 100.0 /100 | #15 | Exceptional 20.8% |
| Immigrants | Belgium | 100.0 /100 | #16 | Exceptional 20.8% |
| Immigrants | South Central Asia | 100.0 /100 | #17 | Exceptional 20.7% |
| Soviet Union | 100.0 /100 | #18 | Exceptional 20.5% |
| Immigrants | Hong Kong | 100.0 /100 | #19 | Exceptional 20.5% |
| Indians (Asian) | 100.0 /100 | #20 | Exceptional 20.5% |
| Immigrants | Ireland | 100.0 /100 | #21 | Exceptional 20.4% |
| Israelis | 100.0 /100 | #22 | Exceptional 20.3% |
| Immigrants | France | 100.0 /100 | #23 | Exceptional 20.3% |
| Immigrants | Sweden | 100.0 /100 | #24 | Exceptional 20.3% |
| Immigrants | Japan | 100.0 /100 | #25 | Exceptional 20.0% |
| Cambodians | 100.0 /100 | #26 | Exceptional 20.0% |
| Immigrants | Sri Lanka | 100.0 /100 | #27 | Exceptional 19.9% |
Demographics Similar to Spaniards by Master's Degree
In terms of master's degree, the demographic groups most similar to Spaniards are Immigrants (14.6%, a difference of 0.020%), Immigrants from Costa Rica (14.7%, a difference of 0.060%), Basque (14.7%, a difference of 0.10%), Immigrants from Oceania (14.7%, a difference of 0.19%), and Welsh (14.6%, a difference of 0.23%).
| Demographics | Rating | Rank | Master's Degree |
| Sri Lankans | 39.6 /100 | #183 | Fair 14.7% |
| Immigrants | Zaire | 39.5 /100 | #184 | Fair 14.7% |
| Barbadians | 38.3 /100 | #185 | Fair 14.7% |
| Immigrants | Oceania | 37.1 /100 | #186 | Fair 14.7% |
| Basques | 36.5 /100 | #187 | Fair 14.7% |
| Immigrants | Costa Rica | 36.2 /100 | #188 | Fair 14.7% |
| Immigrants | Immigrants | 36.0 /100 | #189 | Fair 14.6% |
| Spaniards | 35.8 /100 | #190 | Fair 14.6% |
| Welsh | 34.2 /100 | #191 | Fair 14.6% |
| Immigrants | Middle Africa | 33.6 /100 | #192 | Fair 14.6% |
| Immigrants | Nigeria | 32.7 /100 | #193 | Fair 14.6% |
| Chinese | 32.5 /100 | #194 | Fair 14.6% |
| Danes | 31.3 /100 | #195 | Fair 14.5% |
| Czechoslovakians | 29.9 /100 | #196 | Fair 14.5% |
| Belgians | 28.0 /100 | #197 | Fair 14.5% |