Immigrants from Uzbekistan vs Spaniard Master's Degree
COMPARE
Immigrants from Uzbekistan
Spaniard
Master's Degree
Master's Degree Comparison
Immigrants from Uzbekistan
Spaniards
17.9%
MASTER'S DEGREE
99.8/ 100
METRIC RATING
69th/ 347
METRIC RANK
14.6%
MASTER'S DEGREE
35.8/ 100
METRIC RATING
190th/ 347
METRIC RANK
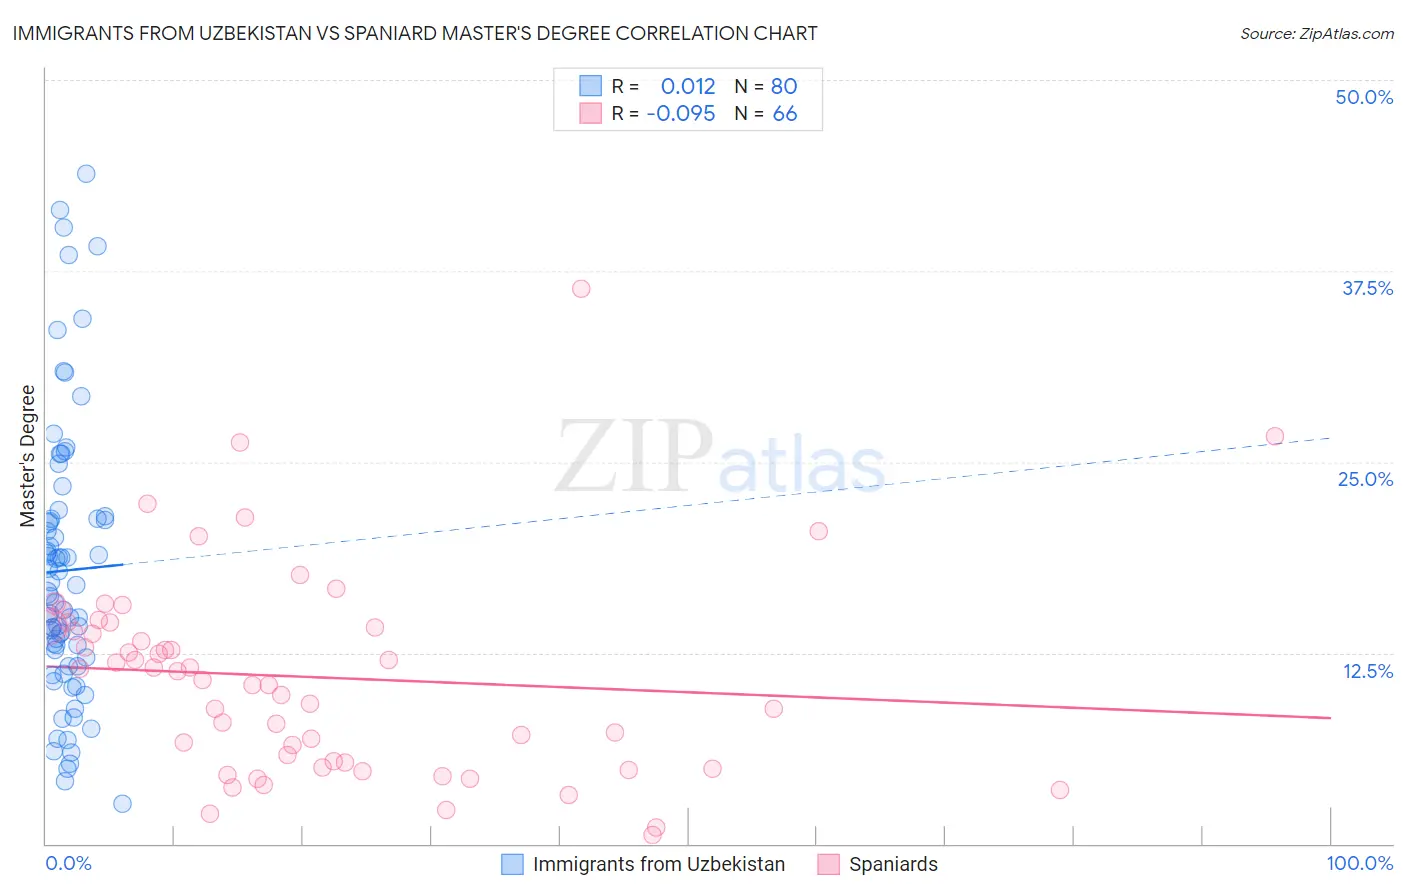
Immigrants from Uzbekistan vs Spaniard Master's Degree Correlation Chart
The statistical analysis conducted on geographies consisting of 118,739,422 people shows no correlation between the proportion of Immigrants from Uzbekistan and percentage of population with at least master's degree education in the United States with a correlation coefficient (R) of 0.012 and weighted average of 17.9%. Similarly, the statistical analysis conducted on geographies consisting of 443,325,255 people shows a slight negative correlation between the proportion of Spaniards and percentage of population with at least master's degree education in the United States with a correlation coefficient (R) of -0.095 and weighted average of 14.6%, a difference of 22.0%.
Master's Degree Correlation Summary
| Measurement | Immigrants from Uzbekistan | Spaniard |
| Minimum | 2.6% | 0.56% |
| Maximum | 43.9% | 36.4% |
| Range | 41.3% | 35.8% |
| Mean | 17.9% | 10.9% |
| Median | 16.3% | 11.0% |
| Interquartile 25% (IQ1) | 11.9% | 5.3% |
| Interquartile 75% (IQ3) | 21.3% | 14.2% |
| Interquartile Range (IQR) | 9.4% | 8.9% |
| Standard Deviation (Sample) | 9.0% | 6.7% |
| Standard Deviation (Population) | 9.0% | 6.6% |
Similar Demographics by Master's Degree
Demographics Similar to Immigrants from Uzbekistan by Master's Degree
In terms of master's degree, the demographic groups most similar to Immigrants from Uzbekistan are Immigrants from Western Europe (17.8%, a difference of 0.22%), Immigrants from Ethiopia (17.9%, a difference of 0.33%), Immigrants from Pakistan (17.8%, a difference of 0.50%), Immigrants from Argentina (18.0%, a difference of 0.55%), and Ethiopian (18.0%, a difference of 0.60%).
| Demographics | Rating | Rank | Master's Degree |
| Argentineans | 99.9 /100 | #62 | Exceptional 18.2% |
| Immigrants | Netherlands | 99.9 /100 | #63 | Exceptional 18.1% |
| South Africans | 99.9 /100 | #64 | Exceptional 18.1% |
| Immigrants | Kazakhstan | 99.8 /100 | #65 | Exceptional 18.0% |
| Ethiopians | 99.8 /100 | #66 | Exceptional 18.0% |
| Immigrants | Argentina | 99.8 /100 | #67 | Exceptional 18.0% |
| Immigrants | Ethiopia | 99.8 /100 | #68 | Exceptional 17.9% |
| Immigrants | Uzbekistan | 99.8 /100 | #69 | Exceptional 17.9% |
| Immigrants | Western Europe | 99.8 /100 | #70 | Exceptional 17.8% |
| Immigrants | Pakistan | 99.7 /100 | #71 | Exceptional 17.8% |
| Lithuanians | 99.7 /100 | #72 | Exceptional 17.7% |
| Zimbabweans | 99.7 /100 | #73 | Exceptional 17.7% |
| Immigrants | Romania | 99.7 /100 | #74 | Exceptional 17.7% |
| Egyptians | 99.6 /100 | #75 | Exceptional 17.6% |
| Immigrants | Indonesia | 99.6 /100 | #76 | Exceptional 17.6% |
Demographics Similar to Spaniards by Master's Degree
In terms of master's degree, the demographic groups most similar to Spaniards are Immigrants (14.6%, a difference of 0.020%), Immigrants from Costa Rica (14.7%, a difference of 0.060%), Basque (14.7%, a difference of 0.10%), Immigrants from Oceania (14.7%, a difference of 0.19%), and Welsh (14.6%, a difference of 0.23%).
| Demographics | Rating | Rank | Master's Degree |
| Sri Lankans | 39.6 /100 | #183 | Fair 14.7% |
| Immigrants | Zaire | 39.5 /100 | #184 | Fair 14.7% |
| Barbadians | 38.3 /100 | #185 | Fair 14.7% |
| Immigrants | Oceania | 37.1 /100 | #186 | Fair 14.7% |
| Basques | 36.5 /100 | #187 | Fair 14.7% |
| Immigrants | Costa Rica | 36.2 /100 | #188 | Fair 14.7% |
| Immigrants | Immigrants | 36.0 /100 | #189 | Fair 14.6% |
| Spaniards | 35.8 /100 | #190 | Fair 14.6% |
| Welsh | 34.2 /100 | #191 | Fair 14.6% |
| Immigrants | Middle Africa | 33.6 /100 | #192 | Fair 14.6% |
| Immigrants | Nigeria | 32.7 /100 | #193 | Fair 14.6% |
| Chinese | 32.5 /100 | #194 | Fair 14.6% |
| Danes | 31.3 /100 | #195 | Fair 14.5% |
| Czechoslovakians | 29.9 /100 | #196 | Fair 14.5% |
| Belgians | 28.0 /100 | #197 | Fair 14.5% |