Immigrants from Germany vs Spanish Nursery School
COMPARE
Immigrants from Germany
Spanish
Nursery School
Nursery School Comparison
Immigrants from Germany
Spanish
98.3%
NURSERY SCHOOL
98.6/ 100
METRIC RATING
94th/ 347
METRIC RANK
98.2%
NURSERY SCHOOL
95.8/ 100
METRIC RATING
116th/ 347
METRIC RANK
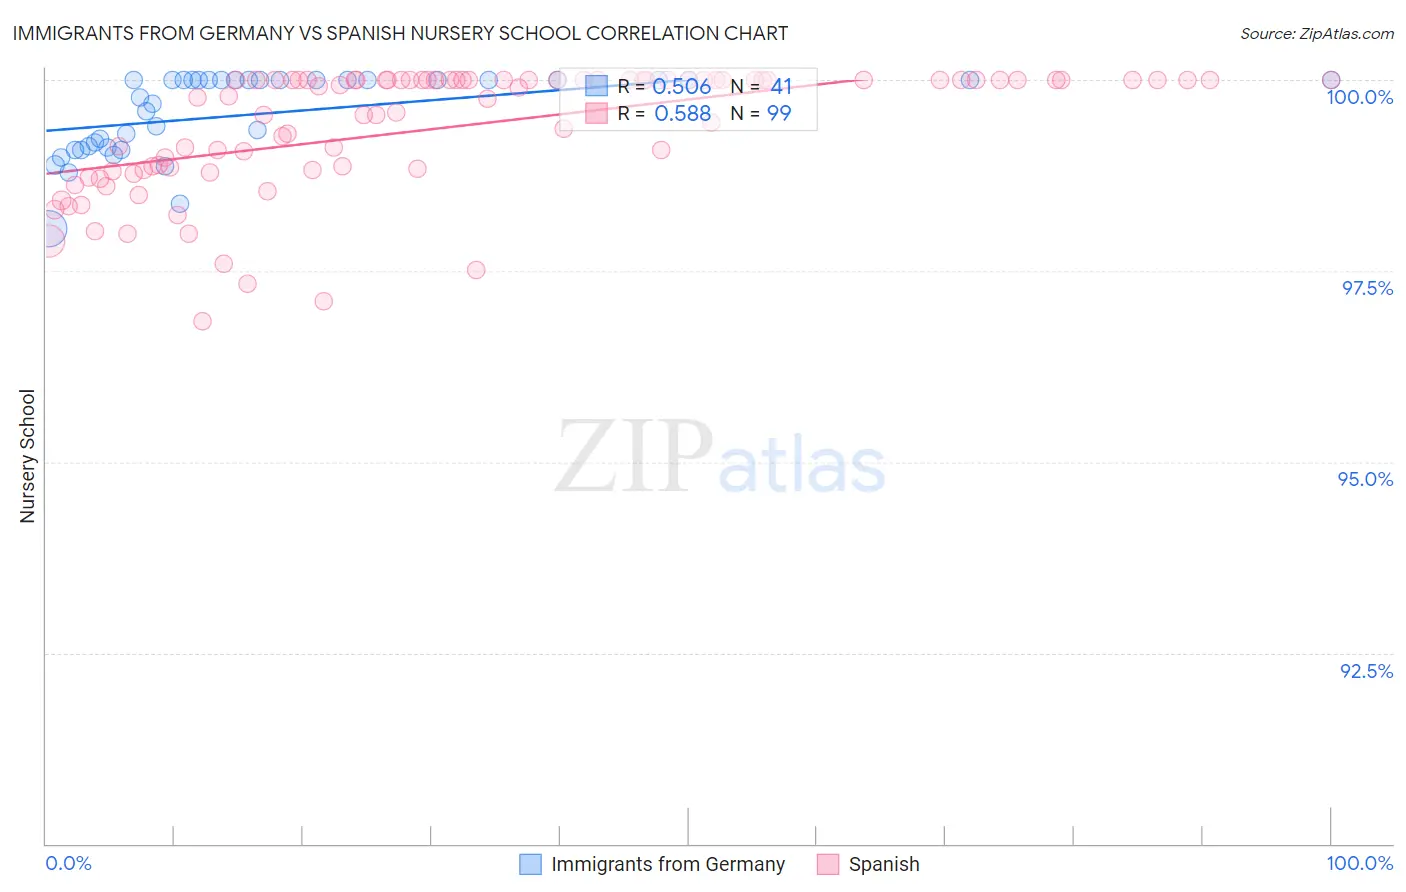
Immigrants from Germany vs Spanish Nursery School Correlation Chart
The statistical analysis conducted on geographies consisting of 463,886,643 people shows a substantial positive correlation between the proportion of Immigrants from Germany and percentage of population with at least nursery school education in the United States with a correlation coefficient (R) of 0.506 and weighted average of 98.3%. Similarly, the statistical analysis conducted on geographies consisting of 422,189,210 people shows a substantial positive correlation between the proportion of Spanish and percentage of population with at least nursery school education in the United States with a correlation coefficient (R) of 0.588 and weighted average of 98.2%, a difference of 0.080%.
Nursery School Correlation Summary
| Measurement | Immigrants from Germany | Spanish |
| Minimum | 98.1% | 96.8% |
| Maximum | 100.0% | 100.0% |
| Range | 1.9% | 3.2% |
| Mean | 99.6% | 99.4% |
| Median | 100.0% | 99.9% |
| Interquartile 25% (IQ1) | 99.1% | 98.8% |
| Interquartile 75% (IQ3) | 100.0% | 100.0% |
| Interquartile Range (IQR) | 0.90% | 1.2% |
| Standard Deviation (Sample) | 0.53% | 0.80% |
| Standard Deviation (Population) | 0.53% | 0.80% |
Similar Demographics by Nursery School
Demographics Similar to Immigrants from Germany by Nursery School
In terms of nursery school, the demographic groups most similar to Immigrants from Germany are South African (98.3%, a difference of 0.0%), Immigrants from Western Europe (98.3%, a difference of 0.010%), Zimbabwean (98.3%, a difference of 0.010%), Macedonian (98.3%, a difference of 0.010%), and Immigrants from India (98.3%, a difference of 0.010%).
| Demographics | Rating | Rank | Nursery School |
| Hopi | 98.9 /100 | #87 | Exceptional 98.3% |
| Ukrainians | 98.9 /100 | #88 | Exceptional 98.3% |
| Immigrants | South Africa | 98.8 /100 | #89 | Exceptional 98.3% |
| Immigrants | Western Europe | 98.8 /100 | #90 | Exceptional 98.3% |
| Zimbabweans | 98.8 /100 | #91 | Exceptional 98.3% |
| Macedonians | 98.7 /100 | #92 | Exceptional 98.3% |
| Immigrants | India | 98.7 /100 | #93 | Exceptional 98.3% |
| Immigrants | Germany | 98.6 /100 | #94 | Exceptional 98.3% |
| South Africans | 98.6 /100 | #95 | Exceptional 98.3% |
| Cypriots | 98.3 /100 | #96 | Exceptional 98.3% |
| Immigrants | Nonimmigrants | 98.3 /100 | #97 | Exceptional 98.3% |
| Choctaw | 98.3 /100 | #98 | Exceptional 98.3% |
| Colville | 98.2 /100 | #99 | Exceptional 98.3% |
| Puget Sound Salish | 98.0 /100 | #100 | Exceptional 98.3% |
| Romanians | 97.9 /100 | #101 | Exceptional 98.3% |
Demographics Similar to Spanish by Nursery School
In terms of nursery school, the demographic groups most similar to Spanish are Immigrants from France (98.2%, a difference of 0.0%), Immigrants from Latvia (98.2%, a difference of 0.010%), Ute (98.2%, a difference of 0.010%), Iranian (98.2%, a difference of 0.010%), and Yugoslavian (98.2%, a difference of 0.010%).
| Demographics | Rating | Rank | Nursery School |
| German Russians | 97.1 /100 | #109 | Exceptional 98.2% |
| Immigrants | Singapore | 96.9 /100 | #110 | Exceptional 98.2% |
| Immigrants | Czechoslovakia | 96.8 /100 | #111 | Exceptional 98.2% |
| Immigrants | Norway | 96.6 /100 | #112 | Exceptional 98.2% |
| Immigrants | Latvia | 96.4 /100 | #113 | Exceptional 98.2% |
| Ute | 96.4 /100 | #114 | Exceptional 98.2% |
| Iranians | 96.3 /100 | #115 | Exceptional 98.2% |
| Spanish | 95.8 /100 | #116 | Exceptional 98.2% |
| Immigrants | France | 95.6 /100 | #117 | Exceptional 98.2% |
| Yugoslavians | 95.4 /100 | #118 | Exceptional 98.2% |
| Thais | 95.0 /100 | #119 | Exceptional 98.2% |
| Okinawans | 94.5 /100 | #120 | Exceptional 98.2% |
| Immigrants | Zimbabwe | 94.2 /100 | #121 | Exceptional 98.2% |
| Immigrants | Japan | 94.0 /100 | #122 | Exceptional 98.2% |
| Syrians | 93.9 /100 | #123 | Exceptional 98.2% |