Immigrants from Germany vs Black/African American Nursery School
COMPARE
Immigrants from Germany
Black/African American
Nursery School
Nursery School Comparison
Immigrants from Germany
Blacks/African Americans
98.3%
NURSERY SCHOOL
98.6/ 100
METRIC RATING
94th/ 347
METRIC RANK
97.9%
NURSERY SCHOOL
29.4/ 100
METRIC RATING
192nd/ 347
METRIC RANK
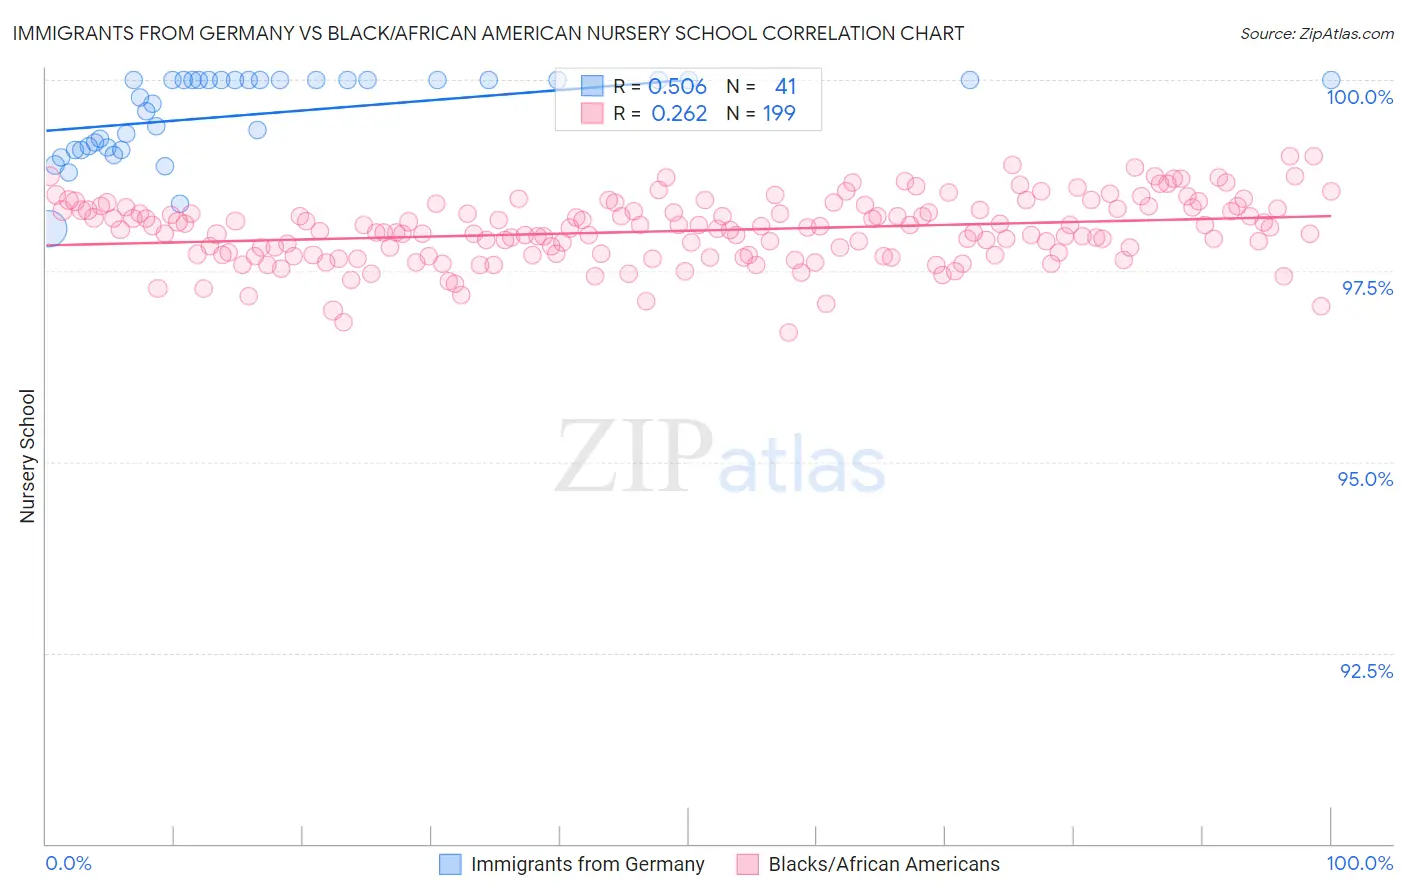
Immigrants from Germany vs Black/African American Nursery School Correlation Chart
The statistical analysis conducted on geographies consisting of 463,886,643 people shows a substantial positive correlation between the proportion of Immigrants from Germany and percentage of population with at least nursery school education in the United States with a correlation coefficient (R) of 0.506 and weighted average of 98.3%. Similarly, the statistical analysis conducted on geographies consisting of 566,043,750 people shows a weak positive correlation between the proportion of Blacks/African Americans and percentage of population with at least nursery school education in the United States with a correlation coefficient (R) of 0.262 and weighted average of 97.9%, a difference of 0.38%.
Nursery School Correlation Summary
| Measurement | Immigrants from Germany | Black/African American |
| Minimum | 98.1% | 96.7% |
| Maximum | 100.0% | 99.0% |
| Range | 1.9% | 2.3% |
| Mean | 99.6% | 98.0% |
| Median | 100.0% | 98.0% |
| Interquartile 25% (IQ1) | 99.1% | 97.7% |
| Interquartile 75% (IQ3) | 100.0% | 98.3% |
| Interquartile Range (IQR) | 0.90% | 0.60% |
| Standard Deviation (Sample) | 0.53% | 0.42% |
| Standard Deviation (Population) | 0.53% | 0.42% |
Similar Demographics by Nursery School
Demographics Similar to Immigrants from Germany by Nursery School
In terms of nursery school, the demographic groups most similar to Immigrants from Germany are South African (98.3%, a difference of 0.0%), Immigrants from Western Europe (98.3%, a difference of 0.010%), Zimbabwean (98.3%, a difference of 0.010%), Macedonian (98.3%, a difference of 0.010%), and Immigrants from India (98.3%, a difference of 0.010%).
| Demographics | Rating | Rank | Nursery School |
| Hopi | 98.9 /100 | #87 | Exceptional 98.3% |
| Ukrainians | 98.9 /100 | #88 | Exceptional 98.3% |
| Immigrants | South Africa | 98.8 /100 | #89 | Exceptional 98.3% |
| Immigrants | Western Europe | 98.8 /100 | #90 | Exceptional 98.3% |
| Zimbabweans | 98.8 /100 | #91 | Exceptional 98.3% |
| Macedonians | 98.7 /100 | #92 | Exceptional 98.3% |
| Immigrants | India | 98.7 /100 | #93 | Exceptional 98.3% |
| Immigrants | Germany | 98.6 /100 | #94 | Exceptional 98.3% |
| South Africans | 98.6 /100 | #95 | Exceptional 98.3% |
| Cypriots | 98.3 /100 | #96 | Exceptional 98.3% |
| Immigrants | Nonimmigrants | 98.3 /100 | #97 | Exceptional 98.3% |
| Choctaw | 98.3 /100 | #98 | Exceptional 98.3% |
| Colville | 98.2 /100 | #99 | Exceptional 98.3% |
| Puget Sound Salish | 98.0 /100 | #100 | Exceptional 98.3% |
| Romanians | 97.9 /100 | #101 | Exceptional 98.3% |
Demographics Similar to Blacks/African Americans by Nursery School
In terms of nursery school, the demographic groups most similar to Blacks/African Americans are Immigrants from Taiwan (97.9%, a difference of 0.0%), Paraguayan (97.9%, a difference of 0.010%), Mongolian (97.9%, a difference of 0.010%), Hawaiian (97.9%, a difference of 0.010%), and Guamanian/Chamorro (97.9%, a difference of 0.010%).
| Demographics | Rating | Rank | Nursery School |
| Immigrants | Belarus | 41.0 /100 | #185 | Average 98.0% |
| Immigrants | Argentina | 40.8 /100 | #186 | Average 98.0% |
| Immigrants | Kazakhstan | 37.1 /100 | #187 | Fair 97.9% |
| Arabs | 34.7 /100 | #188 | Fair 97.9% |
| Pakistanis | 34.6 /100 | #189 | Fair 97.9% |
| Panamanians | 34.3 /100 | #190 | Fair 97.9% |
| Immigrants | Taiwan | 30.6 /100 | #191 | Fair 97.9% |
| Blacks/African Americans | 29.4 /100 | #192 | Fair 97.9% |
| Paraguayans | 27.4 /100 | #193 | Fair 97.9% |
| Mongolians | 27.3 /100 | #194 | Fair 97.9% |
| Hawaiians | 27.2 /100 | #195 | Fair 97.9% |
| Guamanians/Chamorros | 25.7 /100 | #196 | Fair 97.9% |
| Yuman | 25.7 /100 | #197 | Fair 97.9% |
| Immigrants | Kenya | 24.1 /100 | #198 | Fair 97.9% |
| Immigrants | Egypt | 22.5 /100 | #199 | Fair 97.9% |