Immigrants from Germany vs Spanish Bachelor's Degree
COMPARE
Immigrants from Germany
Spanish
Bachelor's Degree
Bachelor's Degree Comparison
Immigrants from Germany
Spanish
38.6%
BACHELOR'S DEGREE
69.6/ 100
METRIC RATING
158th/ 347
METRIC RANK
35.8%
BACHELOR'S DEGREE
9.6/ 100
METRIC RATING
220th/ 347
METRIC RANK
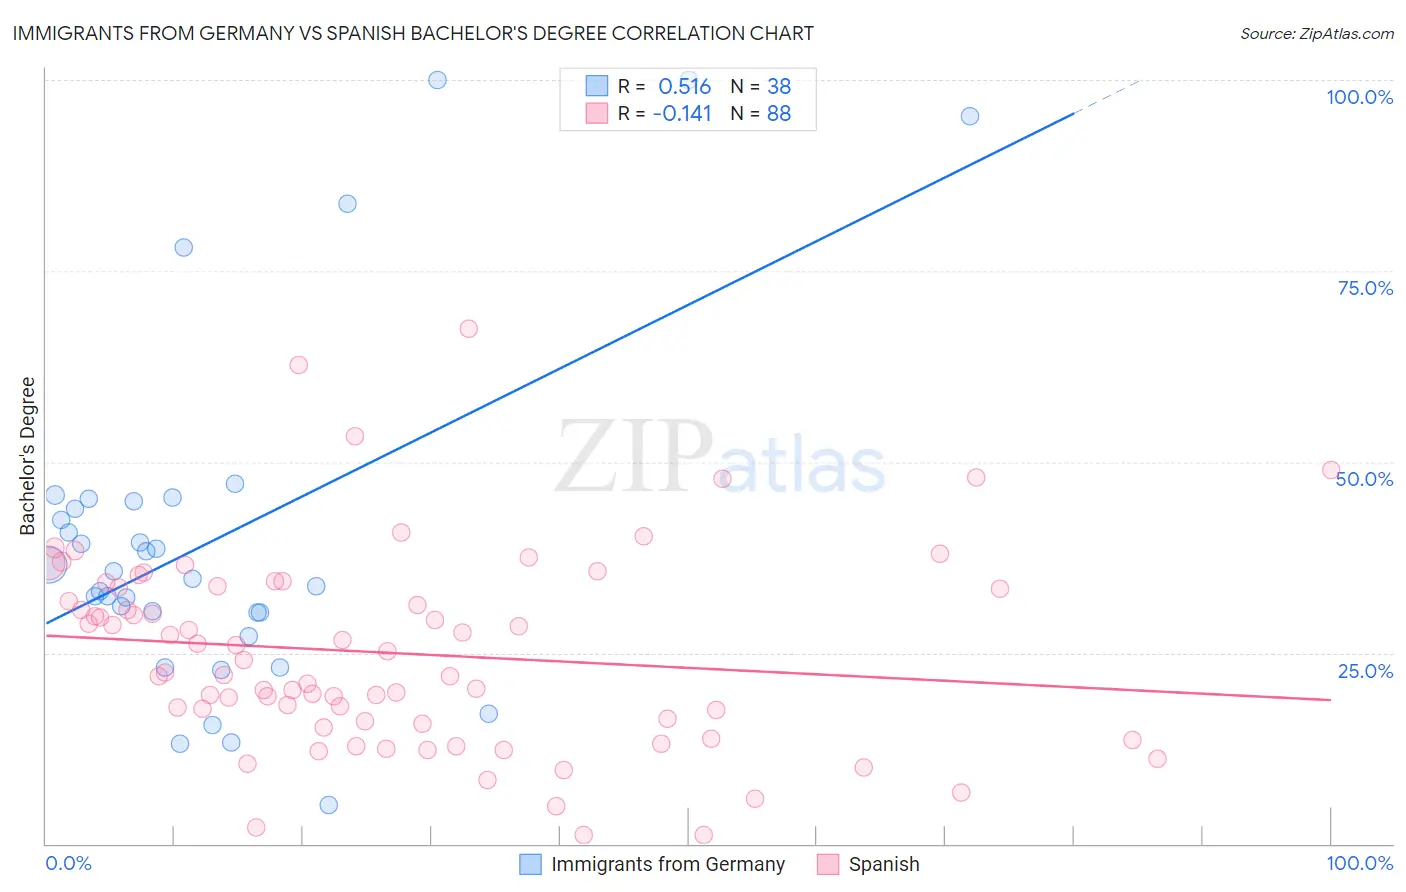
Immigrants from Germany vs Spanish Bachelor's Degree Correlation Chart
The statistical analysis conducted on geographies consisting of 463,864,654 people shows a substantial positive correlation between the proportion of Immigrants from Germany and percentage of population with at least bachelor's degree education in the United States with a correlation coefficient (R) of 0.516 and weighted average of 38.6%. Similarly, the statistical analysis conducted on geographies consisting of 422,162,490 people shows a poor negative correlation between the proportion of Spanish and percentage of population with at least bachelor's degree education in the United States with a correlation coefficient (R) of -0.141 and weighted average of 35.8%, a difference of 7.9%.
Bachelor's Degree Correlation Summary
| Measurement | Immigrants from Germany | Spanish |
| Minimum | 5.1% | 1.1% |
| Maximum | 100.0% | 67.4% |
| Range | 94.9% | 66.3% |
| Mean | 40.0% | 25.0% |
| Median | 35.2% | 23.3% |
| Interquartile 25% (IQ1) | 30.3% | 15.9% |
| Interquartile 75% (IQ3) | 44.9% | 33.6% |
| Interquartile Range (IQR) | 14.6% | 17.8% |
| Standard Deviation (Sample) | 22.8% | 12.9% |
| Standard Deviation (Population) | 22.5% | 12.9% |
Similar Demographics by Bachelor's Degree
Demographics Similar to Immigrants from Germany by Bachelor's Degree
In terms of bachelor's degree, the demographic groups most similar to Immigrants from Germany are Immigrants from South America (38.6%, a difference of 0.060%), Chinese (38.5%, a difference of 0.33%), Vietnamese (38.5%, a difference of 0.33%), Kenyan (38.7%, a difference of 0.34%), and Uruguayan (38.4%, a difference of 0.42%).
| Demographics | Rating | Rank | Bachelor's Degree |
| Immigrants | Africa | 76.5 /100 | #151 | Good 38.9% |
| Sudanese | 76.4 /100 | #152 | Good 38.9% |
| Slavs | 75.9 /100 | #153 | Good 38.9% |
| Canadians | 75.0 /100 | #154 | Good 38.8% |
| Immigrants | Kenya | 73.8 /100 | #155 | Good 38.8% |
| Kenyans | 72.5 /100 | #156 | Good 38.7% |
| Immigrants | South America | 70.1 /100 | #157 | Good 38.6% |
| Immigrants | Germany | 69.6 /100 | #158 | Good 38.6% |
| Chinese | 66.6 /100 | #159 | Good 38.5% |
| Vietnamese | 66.6 /100 | #160 | Good 38.5% |
| Uruguayans | 65.8 /100 | #161 | Good 38.4% |
| Colombians | 65.0 /100 | #162 | Good 38.4% |
| Peruvians | 63.4 /100 | #163 | Good 38.3% |
| Hungarians | 62.1 /100 | #164 | Good 38.3% |
| Sri Lankans | 59.1 /100 | #165 | Average 38.2% |
Demographics Similar to Spanish by Bachelor's Degree
In terms of bachelor's degree, the demographic groups most similar to Spanish are West Indian (35.8%, a difference of 0.040%), Subsaharan African (35.8%, a difference of 0.070%), Dutch (35.7%, a difference of 0.11%), German Russian (35.8%, a difference of 0.17%), and Trinidadian and Tobagonian (35.7%, a difference of 0.25%).
| Demographics | Rating | Rank | Bachelor's Degree |
| Immigrants | Panama | 14.2 /100 | #213 | Poor 36.2% |
| Germans | 13.9 /100 | #214 | Poor 36.1% |
| Immigrants | Western Africa | 13.8 /100 | #215 | Poor 36.1% |
| Barbadians | 13.5 /100 | #216 | Poor 36.1% |
| German Russians | 10.2 /100 | #217 | Poor 35.8% |
| Sub-Saharan Africans | 9.8 /100 | #218 | Tragic 35.8% |
| West Indians | 9.7 /100 | #219 | Tragic 35.8% |
| Spanish | 9.6 /100 | #220 | Tragic 35.8% |
| Dutch | 9.2 /100 | #221 | Tragic 35.7% |
| Trinidadians and Tobagonians | 8.8 /100 | #222 | Tragic 35.7% |
| French Canadians | 8.3 /100 | #223 | Tragic 35.6% |
| Immigrants | Barbados | 7.5 /100 | #224 | Tragic 35.5% |
| Immigrants | Burma/Myanmar | 7.3 /100 | #225 | Tragic 35.5% |
| Portuguese | 7.2 /100 | #226 | Tragic 35.5% |
| Ecuadorians | 6.6 /100 | #227 | Tragic 35.4% |