Immigrants from Germany vs Sierra Leonean 9th Grade
COMPARE
Immigrants from Germany
Sierra Leonean
9th Grade
9th Grade Comparison
Immigrants from Germany
Sierra Leoneans
95.6%
9TH GRADE
98.7/ 100
METRIC RATING
93rd/ 347
METRIC RANK
94.8%
9TH GRADE
42.7/ 100
METRIC RATING
181st/ 347
METRIC RANK
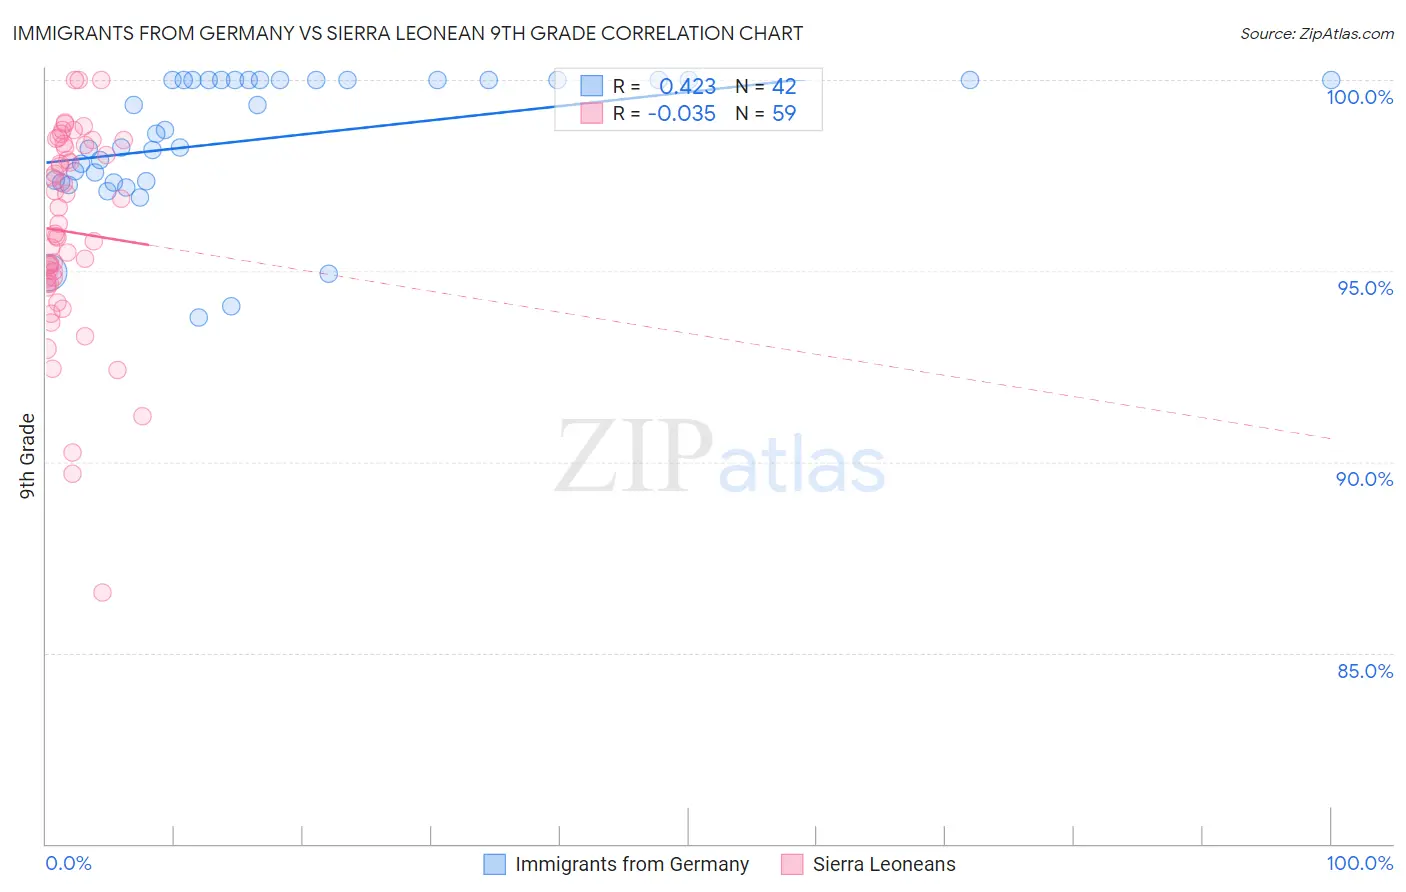
Immigrants from Germany vs Sierra Leonean 9th Grade Correlation Chart
The statistical analysis conducted on geographies consisting of 463,886,920 people shows a moderate positive correlation between the proportion of Immigrants from Germany and percentage of population with at least 9th grade education in the United States with a correlation coefficient (R) of 0.423 and weighted average of 95.6%. Similarly, the statistical analysis conducted on geographies consisting of 83,357,120 people shows no correlation between the proportion of Sierra Leoneans and percentage of population with at least 9th grade education in the United States with a correlation coefficient (R) of -0.035 and weighted average of 94.8%, a difference of 0.85%.
9th Grade Correlation Summary
| Measurement | Immigrants from Germany | Sierra Leonean |
| Minimum | 93.8% | 86.6% |
| Maximum | 100.0% | 100.0% |
| Range | 6.2% | 13.4% |
| Mean | 98.5% | 96.0% |
| Median | 98.6% | 96.0% |
| Interquartile 25% (IQ1) | 97.3% | 94.7% |
| Interquartile 75% (IQ3) | 100.0% | 98.3% |
| Interquartile Range (IQR) | 2.7% | 3.6% |
| Standard Deviation (Sample) | 1.7% | 2.7% |
| Standard Deviation (Population) | 1.7% | 2.7% |
Similar Demographics by 9th Grade
Demographics Similar to Immigrants from Germany by 9th Grade
In terms of 9th grade, the demographic groups most similar to Immigrants from Germany are Immigrants from Latvia (95.6%, a difference of 0.0%), Creek (95.6%, a difference of 0.010%), Immigrants from Saudi Arabia (95.6%, a difference of 0.010%), Yugoslavian (95.7%, a difference of 0.020%), and South African (95.6%, a difference of 0.020%).
| Demographics | Rating | Rank | 9th Grade |
| Immigrants | Western Europe | 99.1 /100 | #86 | Exceptional 95.7% |
| Okinawans | 99.0 /100 | #87 | Exceptional 95.7% |
| Immigrants | Czechoslovakia | 98.9 /100 | #88 | Exceptional 95.7% |
| Yugoslavians | 98.9 /100 | #89 | Exceptional 95.7% |
| South Africans | 98.8 /100 | #90 | Exceptional 95.6% |
| Creek | 98.8 /100 | #91 | Exceptional 95.6% |
| Immigrants | Saudi Arabia | 98.8 /100 | #92 | Exceptional 95.6% |
| Immigrants | Germany | 98.7 /100 | #93 | Exceptional 95.6% |
| Immigrants | Latvia | 98.7 /100 | #94 | Exceptional 95.6% |
| Americans | 98.5 /100 | #95 | Exceptional 95.6% |
| Filipinos | 98.5 /100 | #96 | Exceptional 95.6% |
| Delaware | 98.4 /100 | #97 | Exceptional 95.6% |
| Immigrants | Japan | 98.4 /100 | #98 | Exceptional 95.6% |
| Menominee | 98.3 /100 | #99 | Exceptional 95.6% |
| Lebanese | 98.1 /100 | #100 | Exceptional 95.6% |
Demographics Similar to Sierra Leoneans by 9th Grade
In terms of 9th grade, the demographic groups most similar to Sierra Leoneans are Immigrants from Uganda (94.8%, a difference of 0.0%), Seminole (94.8%, a difference of 0.0%), Immigrants from Nepal (94.8%, a difference of 0.020%), Immigrants from Poland (94.9%, a difference of 0.030%), and Immigrants from Venezuela (94.9%, a difference of 0.030%).
| Demographics | Rating | Rank | 9th Grade |
| Immigrants | Egypt | 50.0 /100 | #174 | Average 94.9% |
| Brazilians | 49.8 /100 | #175 | Average 94.9% |
| Immigrants | Spain | 49.1 /100 | #176 | Average 94.9% |
| Immigrants | Iraq | 47.8 /100 | #177 | Average 94.9% |
| Immigrants | Poland | 46.7 /100 | #178 | Average 94.9% |
| Immigrants | Venezuela | 46.5 /100 | #179 | Average 94.9% |
| Immigrants | Uganda | 43.1 /100 | #180 | Average 94.8% |
| Sierra Leoneans | 42.7 /100 | #181 | Average 94.8% |
| Seminole | 42.5 /100 | #182 | Average 94.8% |
| Immigrants | Nepal | 39.7 /100 | #183 | Fair 94.8% |
| Argentineans | 37.6 /100 | #184 | Fair 94.8% |
| Liberians | 37.4 /100 | #185 | Fair 94.8% |
| Hopi | 37.1 /100 | #186 | Fair 94.8% |
| Guamanians/Chamorros | 35.5 /100 | #187 | Fair 94.8% |
| Immigrants | Albania | 34.5 /100 | #188 | Fair 94.8% |