Immigrants from Germany vs Immigrants from Trinidad and Tobago Currently Married
COMPARE
Immigrants from Germany
Immigrants from Trinidad and Tobago
Currently Married
Currently Married Comparison
Immigrants from Germany
Immigrants from Trinidad and Tobago
47.8%
CURRENTLY MARRIED
94.1/ 100
METRIC RATING
101st/ 347
METRIC RANK
41.9%
CURRENTLY MARRIED
0.0/ 100
METRIC RATING
305th/ 347
METRIC RANK
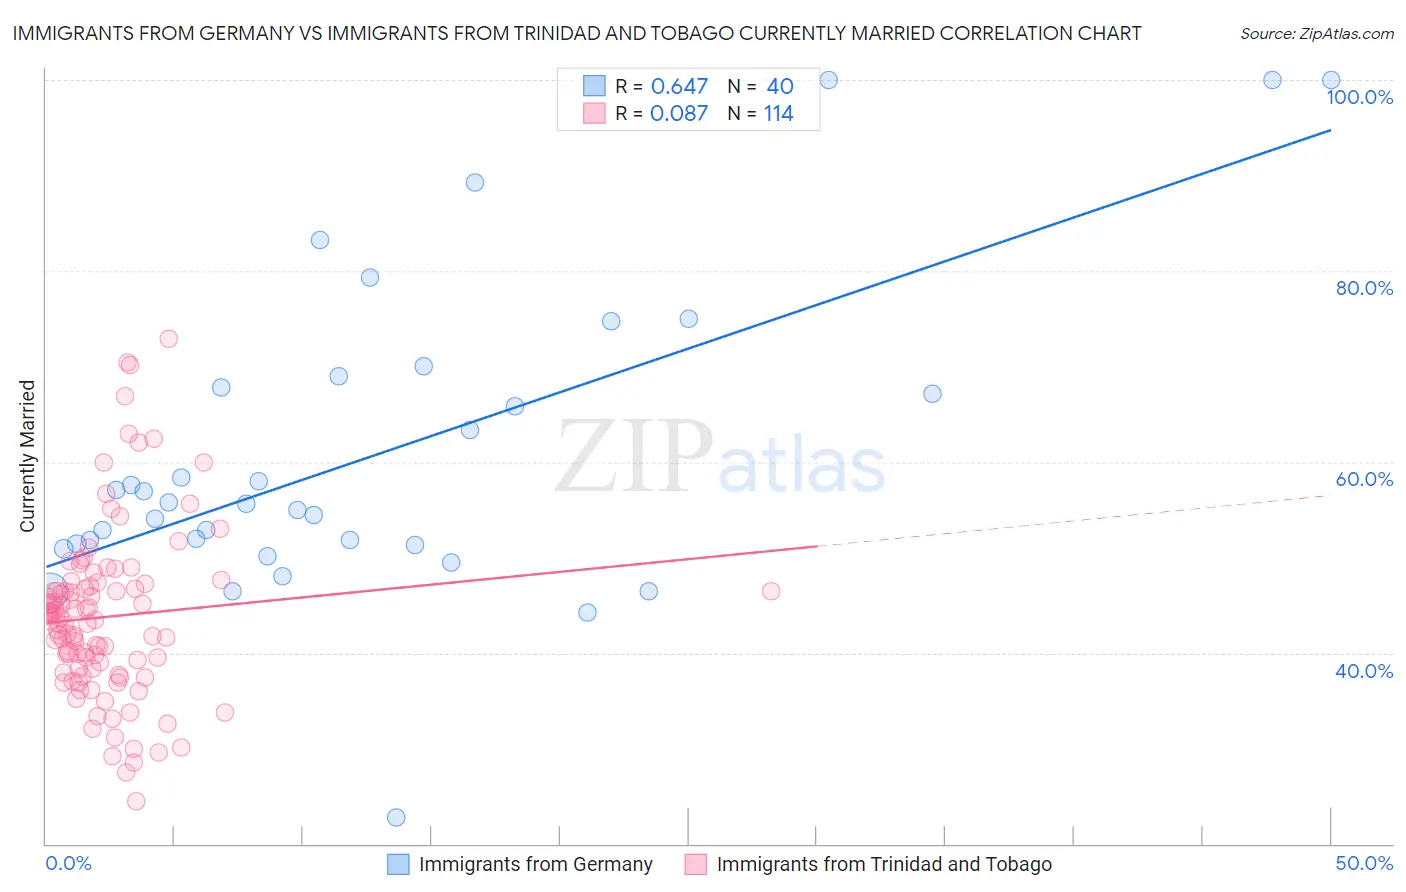
Immigrants from Germany vs Immigrants from Trinidad and Tobago Currently Married Correlation Chart
The statistical analysis conducted on geographies consisting of 463,859,108 people shows a significant positive correlation between the proportion of Immigrants from Germany and percentage of population currently married in the United States with a correlation coefficient (R) of 0.647 and weighted average of 47.8%. Similarly, the statistical analysis conducted on geographies consisting of 223,527,783 people shows a slight positive correlation between the proportion of Immigrants from Trinidad and Tobago and percentage of population currently married in the United States with a correlation coefficient (R) of 0.087 and weighted average of 41.9%, a difference of 14.1%.
Currently Married Correlation Summary
| Measurement | Immigrants from Germany | Immigrants from Trinidad and Tobago |
| Minimum | 22.7% | 24.4% |
| Maximum | 100.0% | 72.9% |
| Range | 77.3% | 48.5% |
| Mean | 60.9% | 43.8% |
| Median | 55.7% | 43.4% |
| Interquartile 25% (IQ1) | 51.4% | 38.3% |
| Interquartile 75% (IQ3) | 68.4% | 47.0% |
| Interquartile Range (IQR) | 17.0% | 8.7% |
| Standard Deviation (Sample) | 16.5% | 8.9% |
| Standard Deviation (Population) | 16.3% | 8.9% |
Similar Demographics by Currently Married
Demographics Similar to Immigrants from Germany by Currently Married
In terms of currently married, the demographic groups most similar to Immigrants from Germany are Celtic (47.8%, a difference of 0.020%), Turkish (47.8%, a difference of 0.020%), Immigrants from Sweden (47.8%, a difference of 0.040%), Cypriot (47.8%, a difference of 0.050%), and Serbian (47.8%, a difference of 0.070%).
| Demographics | Rating | Rank | Currently Married |
| Native Hawaiians | 95.0 /100 | #94 | Exceptional 47.9% |
| Immigrants | Bulgaria | 94.8 /100 | #95 | Exceptional 47.9% |
| Egyptians | 94.8 /100 | #96 | Exceptional 47.9% |
| Immigrants | Ukraine | 94.8 /100 | #97 | Exceptional 47.9% |
| Immigrants | China | 94.7 /100 | #98 | Exceptional 47.9% |
| Immigrants | Sweden | 94.3 /100 | #99 | Exceptional 47.8% |
| Celtics | 94.2 /100 | #100 | Exceptional 47.8% |
| Immigrants | Germany | 94.1 /100 | #101 | Exceptional 47.8% |
| Turks | 93.9 /100 | #102 | Exceptional 47.8% |
| Cypriots | 93.7 /100 | #103 | Exceptional 47.8% |
| Serbians | 93.6 /100 | #104 | Exceptional 47.8% |
| Immigrants | Singapore | 93.3 /100 | #105 | Exceptional 47.8% |
| Immigrants | Greece | 93.1 /100 | #106 | Exceptional 47.7% |
| Immigrants | Italy | 92.9 /100 | #107 | Exceptional 47.7% |
| Tsimshian | 92.4 /100 | #108 | Exceptional 47.7% |
Demographics Similar to Immigrants from Trinidad and Tobago by Currently Married
In terms of currently married, the demographic groups most similar to Immigrants from Trinidad and Tobago are Immigrants from Guyana (41.9%, a difference of 0.010%), Immigrants from Bahamas (41.9%, a difference of 0.030%), African (41.8%, a difference of 0.14%), Sioux (41.9%, a difference of 0.15%), and Immigrants from Zaire (42.0%, a difference of 0.16%).
| Demographics | Rating | Rank | Currently Married |
| Immigrants | Honduras | 0.0 /100 | #298 | Tragic 42.2% |
| Liberians | 0.0 /100 | #299 | Tragic 42.2% |
| Belizeans | 0.0 /100 | #300 | Tragic 42.2% |
| Immigrants | Yemen | 0.0 /100 | #301 | Tragic 42.1% |
| Immigrants | Zaire | 0.0 /100 | #302 | Tragic 42.0% |
| Sioux | 0.0 /100 | #303 | Tragic 41.9% |
| Immigrants | Bahamas | 0.0 /100 | #304 | Tragic 41.9% |
| Immigrants | Trinidad and Tobago | 0.0 /100 | #305 | Tragic 41.9% |
| Immigrants | Guyana | 0.0 /100 | #306 | Tragic 41.9% |
| Africans | 0.0 /100 | #307 | Tragic 41.8% |
| Immigrants | Belize | 0.0 /100 | #308 | Tragic 41.8% |
| Immigrants | Liberia | 0.0 /100 | #309 | Tragic 41.8% |
| Guyanese | 0.0 /100 | #310 | Tragic 41.6% |
| Trinidadians and Tobagonians | 0.0 /100 | #311 | Tragic 41.5% |
| Somalis | 0.0 /100 | #312 | Tragic 41.5% |