Immigrants from Canada vs Black/African American Nursery School
COMPARE
Immigrants from Canada
Black/African American
Nursery School
Nursery School Comparison
Immigrants from Canada
Blacks/African Americans
98.4%
NURSERY SCHOOL
99.8/ 100
METRIC RATING
59th/ 347
METRIC RANK
97.9%
NURSERY SCHOOL
29.4/ 100
METRIC RATING
192nd/ 347
METRIC RANK
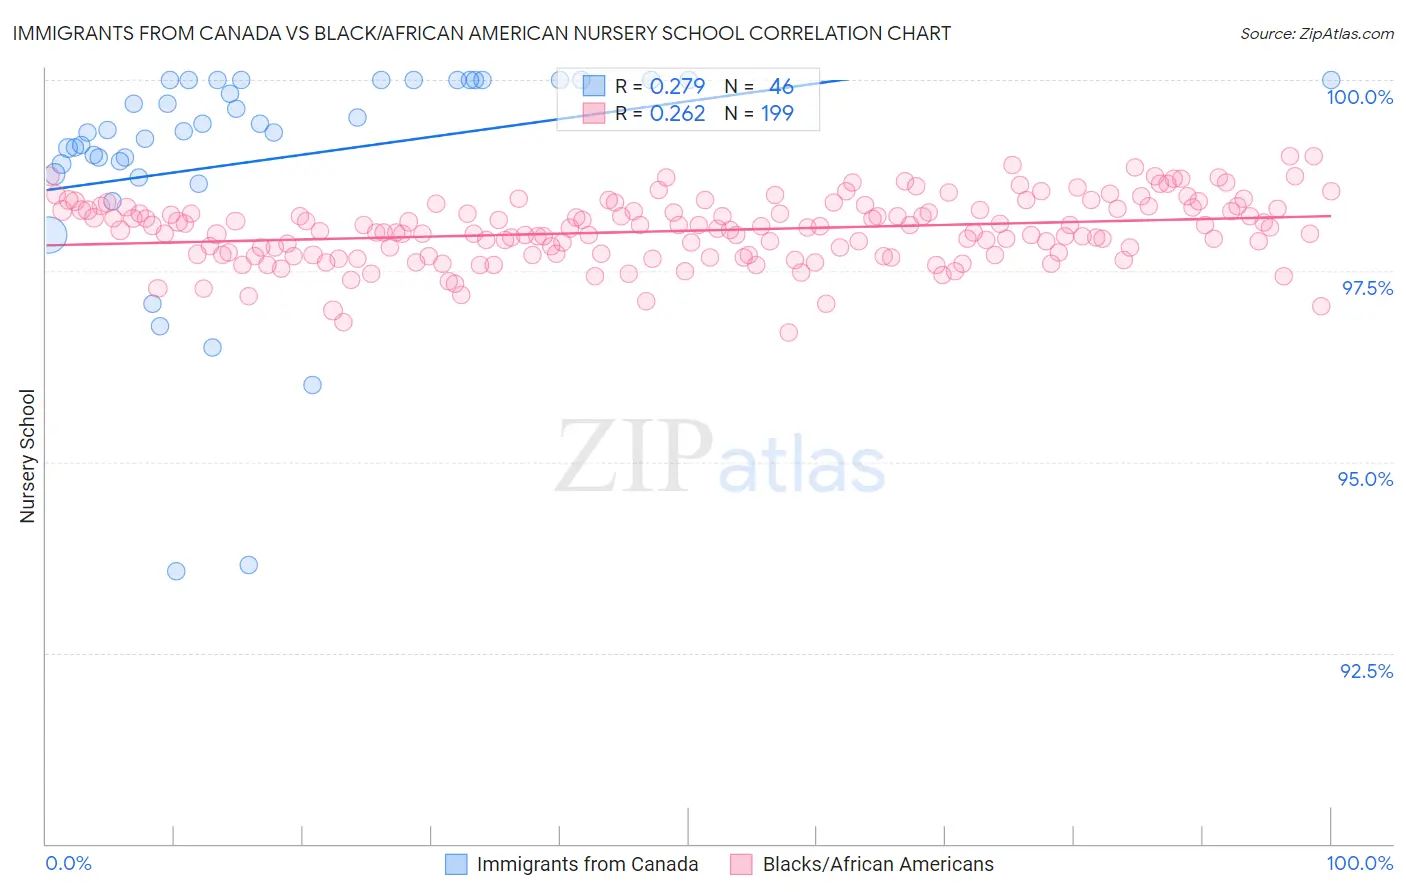
Immigrants from Canada vs Black/African American Nursery School Correlation Chart
The statistical analysis conducted on geographies consisting of 459,397,554 people shows a weak positive correlation between the proportion of Immigrants from Canada and percentage of population with at least nursery school education in the United States with a correlation coefficient (R) of 0.279 and weighted average of 98.4%. Similarly, the statistical analysis conducted on geographies consisting of 566,043,750 people shows a weak positive correlation between the proportion of Blacks/African Americans and percentage of population with at least nursery school education in the United States with a correlation coefficient (R) of 0.262 and weighted average of 97.9%, a difference of 0.52%.
Nursery School Correlation Summary
| Measurement | Immigrants from Canada | Black/African American |
| Minimum | 93.6% | 96.7% |
| Maximum | 100.0% | 99.0% |
| Range | 6.4% | 2.3% |
| Mean | 99.0% | 98.0% |
| Median | 99.3% | 98.0% |
| Interquartile 25% (IQ1) | 98.9% | 97.7% |
| Interquartile 75% (IQ3) | 100.0% | 98.3% |
| Interquartile Range (IQR) | 1.1% | 0.60% |
| Standard Deviation (Sample) | 1.5% | 0.42% |
| Standard Deviation (Population) | 1.5% | 0.42% |
Similar Demographics by Nursery School
Demographics Similar to Immigrants from Canada by Nursery School
In terms of nursery school, the demographic groups most similar to Immigrants from Canada are Bulgarian (98.4%, a difference of 0.0%), Slavic (98.4%, a difference of 0.0%), New Zealander (98.4%, a difference of 0.0%), Creek (98.4%, a difference of 0.0%), and Immigrants from North America (98.4%, a difference of 0.0%).
| Demographics | Rating | Rank | Nursery School |
| Australians | 99.8 /100 | #52 | Exceptional 98.5% |
| Kiowa | 99.8 /100 | #53 | Exceptional 98.4% |
| Pueblo | 99.8 /100 | #54 | Exceptional 98.4% |
| Immigrants | Scotland | 99.8 /100 | #55 | Exceptional 98.4% |
| Americans | 99.8 /100 | #56 | Exceptional 98.4% |
| Austrians | 99.8 /100 | #57 | Exceptional 98.4% |
| Bulgarians | 99.8 /100 | #58 | Exceptional 98.4% |
| Immigrants | Canada | 99.8 /100 | #59 | Exceptional 98.4% |
| Slavs | 99.8 /100 | #60 | Exceptional 98.4% |
| New Zealanders | 99.7 /100 | #61 | Exceptional 98.4% |
| Creek | 99.7 /100 | #62 | Exceptional 98.4% |
| Immigrants | North America | 99.7 /100 | #63 | Exceptional 98.4% |
| Greeks | 99.7 /100 | #64 | Exceptional 98.4% |
| Maltese | 99.7 /100 | #65 | Exceptional 98.4% |
| Canadians | 99.7 /100 | #66 | Exceptional 98.4% |
Demographics Similar to Blacks/African Americans by Nursery School
In terms of nursery school, the demographic groups most similar to Blacks/African Americans are Immigrants from Taiwan (97.9%, a difference of 0.0%), Paraguayan (97.9%, a difference of 0.010%), Mongolian (97.9%, a difference of 0.010%), Hawaiian (97.9%, a difference of 0.010%), and Guamanian/Chamorro (97.9%, a difference of 0.010%).
| Demographics | Rating | Rank | Nursery School |
| Immigrants | Belarus | 41.0 /100 | #185 | Average 98.0% |
| Immigrants | Argentina | 40.8 /100 | #186 | Average 98.0% |
| Immigrants | Kazakhstan | 37.1 /100 | #187 | Fair 97.9% |
| Arabs | 34.7 /100 | #188 | Fair 97.9% |
| Pakistanis | 34.6 /100 | #189 | Fair 97.9% |
| Panamanians | 34.3 /100 | #190 | Fair 97.9% |
| Immigrants | Taiwan | 30.6 /100 | #191 | Fair 97.9% |
| Blacks/African Americans | 29.4 /100 | #192 | Fair 97.9% |
| Paraguayans | 27.4 /100 | #193 | Fair 97.9% |
| Mongolians | 27.3 /100 | #194 | Fair 97.9% |
| Hawaiians | 27.2 /100 | #195 | Fair 97.9% |
| Guamanians/Chamorros | 25.7 /100 | #196 | Fair 97.9% |
| Yuman | 25.7 /100 | #197 | Fair 97.9% |
| Immigrants | Kenya | 24.1 /100 | #198 | Fair 97.9% |
| Immigrants | Egypt | 22.5 /100 | #199 | Fair 97.9% |