Immigrants from France vs South American Indian College, 1 year or more
COMPARE
Immigrants from France
South American Indian
College, 1 year or more
College, 1 year or more Comparison
Immigrants from France
South American Indians
65.8%
COLLEGE, 1 YEAR OR MORE
100.0/ 100
METRIC RATING
28th/ 347
METRIC RANK
60.0%
COLLEGE, 1 YEAR OR MORE
66.9/ 100
METRIC RATING
160th/ 347
METRIC RANK
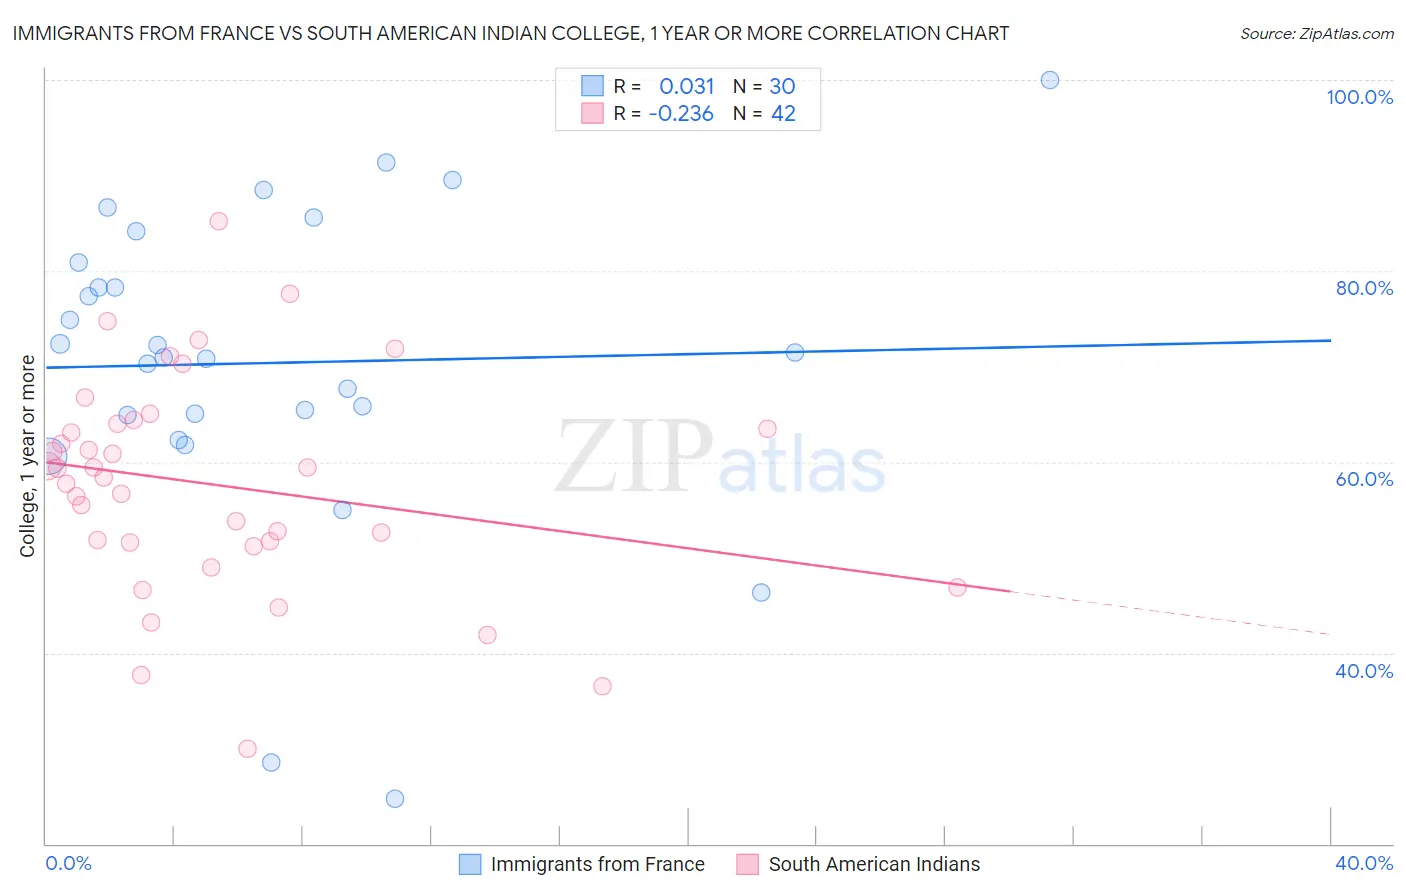
Immigrants from France vs South American Indian College, 1 year or more Correlation Chart
The statistical analysis conducted on geographies consisting of 287,918,860 people shows no correlation between the proportion of Immigrants from France and percentage of population with at least college, 1 year or more education in the United States with a correlation coefficient (R) of 0.031 and weighted average of 65.8%. Similarly, the statistical analysis conducted on geographies consisting of 164,573,280 people shows a weak negative correlation between the proportion of South American Indians and percentage of population with at least college, 1 year or more education in the United States with a correlation coefficient (R) of -0.236 and weighted average of 60.0%, a difference of 9.8%.
College, 1 year or more Correlation Summary
| Measurement | Immigrants from France | South American Indian |
| Minimum | 24.7% | 30.0% |
| Maximum | 100.0% | 85.2% |
| Range | 75.3% | 55.2% |
| Mean | 70.4% | 57.6% |
| Median | 71.2% | 58.8% |
| Interquartile 25% (IQ1) | 64.9% | 51.6% |
| Interquartile 75% (IQ3) | 80.9% | 63.9% |
| Interquartile Range (IQR) | 16.0% | 12.3% |
| Standard Deviation (Sample) | 16.6% | 11.4% |
| Standard Deviation (Population) | 16.3% | 11.3% |
Similar Demographics by College, 1 year or more
Demographics Similar to Immigrants from France by College, 1 year or more
In terms of college, 1 year or more, the demographic groups most similar to Immigrants from France are Immigrants from Ireland (65.9%, a difference of 0.17%), Immigrants from Northern Europe (65.6%, a difference of 0.25%), Immigrants from Denmark (65.6%, a difference of 0.36%), Latvian (66.1%, a difference of 0.37%), and Indian (Asian) (66.1%, a difference of 0.41%).
| Demographics | Rating | Rank | College, 1 year or more |
| Immigrants | Hong Kong | 100.0 /100 | #21 | Exceptional 66.4% |
| Soviet Union | 100.0 /100 | #22 | Exceptional 66.4% |
| Immigrants | China | 100.0 /100 | #23 | Exceptional 66.4% |
| Immigrants | Belgium | 100.0 /100 | #24 | Exceptional 66.3% |
| Indians (Asian) | 100.0 /100 | #25 | Exceptional 66.1% |
| Latvians | 100.0 /100 | #26 | Exceptional 66.1% |
| Immigrants | Ireland | 100.0 /100 | #27 | Exceptional 65.9% |
| Immigrants | France | 100.0 /100 | #28 | Exceptional 65.8% |
| Immigrants | Northern Europe | 100.0 /100 | #29 | Exceptional 65.6% |
| Immigrants | Denmark | 100.0 /100 | #30 | Exceptional 65.6% |
| Turks | 100.0 /100 | #31 | Exceptional 65.5% |
| Bulgarians | 100.0 /100 | #32 | Exceptional 65.5% |
| Immigrants | Sri Lanka | 99.9 /100 | #33 | Exceptional 65.4% |
| Israelis | 99.9 /100 | #34 | Exceptional 65.3% |
| Immigrants | Turkey | 99.9 /100 | #35 | Exceptional 65.2% |
Demographics Similar to South American Indians by College, 1 year or more
In terms of college, 1 year or more, the demographic groups most similar to South American Indians are Immigrants from Iraq (60.0%, a difference of 0.010%), English (60.0%, a difference of 0.020%), Immigrants from Armenia (60.0%, a difference of 0.12%), Somali (59.9%, a difference of 0.14%), and Sudanese (60.2%, a difference of 0.38%).
| Demographics | Rating | Rank | College, 1 year or more |
| Sierra Leoneans | 74.1 /100 | #153 | Good 60.2% |
| Sudanese | 73.0 /100 | #154 | Good 60.2% |
| Moroccans | 72.9 /100 | #155 | Good 60.2% |
| Finns | 72.9 /100 | #156 | Good 60.2% |
| Immigrants | Armenia | 68.8 /100 | #157 | Good 60.0% |
| English | 67.2 /100 | #158 | Good 60.0% |
| Immigrants | Iraq | 67.0 /100 | #159 | Good 60.0% |
| South American Indians | 66.9 /100 | #160 | Good 60.0% |
| Somalis | 64.5 /100 | #161 | Good 59.9% |
| Koreans | 58.5 /100 | #162 | Average 59.7% |
| Immigrants | Somalia | 58.3 /100 | #163 | Average 59.7% |
| Belgians | 58.1 /100 | #164 | Average 59.7% |
| Irish | 56.1 /100 | #165 | Average 59.6% |
| Immigrants | Africa | 56.1 /100 | #166 | Average 59.6% |
| Immigrants | North Macedonia | 53.1 /100 | #167 | Average 59.5% |