Creek vs South American Indian College, 1 year or more
COMPARE
Creek
South American Indian
College, 1 year or more
College, 1 year or more Comparison
Creek
South American Indians
52.2%
COLLEGE, 1 YEAR OR MORE
0.0/ 100
METRIC RATING
303rd/ 347
METRIC RANK
60.0%
COLLEGE, 1 YEAR OR MORE
66.9/ 100
METRIC RATING
160th/ 347
METRIC RANK
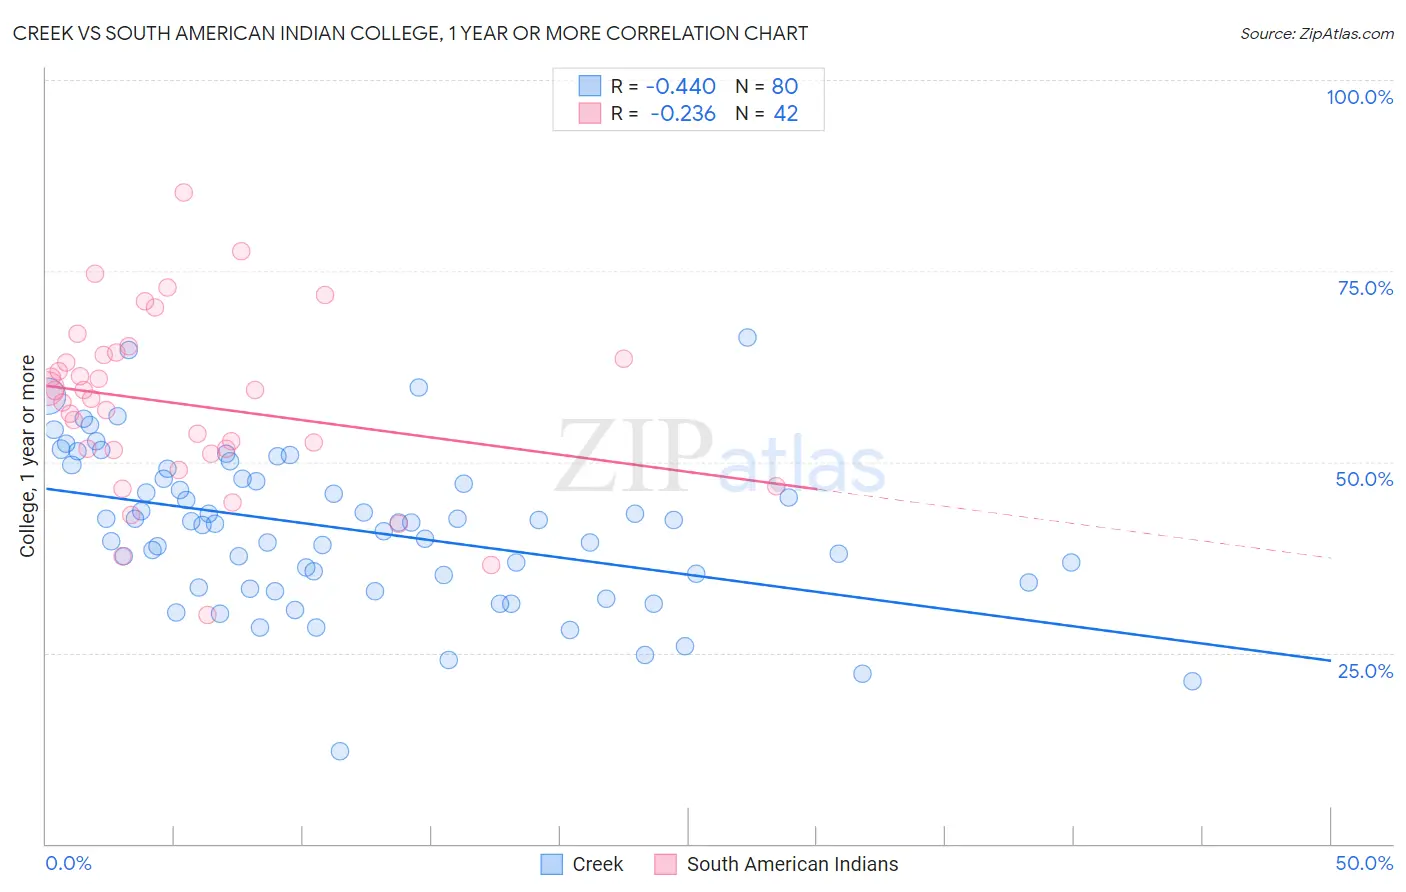
Creek vs South American Indian College, 1 year or more Correlation Chart
The statistical analysis conducted on geographies consisting of 178,480,714 people shows a moderate negative correlation between the proportion of Creek and percentage of population with at least college, 1 year or more education in the United States with a correlation coefficient (R) of -0.440 and weighted average of 52.2%. Similarly, the statistical analysis conducted on geographies consisting of 164,573,280 people shows a weak negative correlation between the proportion of South American Indians and percentage of population with at least college, 1 year or more education in the United States with a correlation coefficient (R) of -0.236 and weighted average of 60.0%, a difference of 14.9%.
College, 1 year or more Correlation Summary
| Measurement | Creek | South American Indian |
| Minimum | 12.0% | 30.0% |
| Maximum | 66.3% | 85.2% |
| Range | 54.2% | 55.2% |
| Mean | 41.1% | 57.6% |
| Median | 42.0% | 58.8% |
| Interquartile 25% (IQ1) | 33.9% | 51.6% |
| Interquartile 75% (IQ3) | 47.8% | 63.9% |
| Interquartile Range (IQR) | 13.9% | 12.3% |
| Standard Deviation (Sample) | 10.1% | 11.4% |
| Standard Deviation (Population) | 10.1% | 11.3% |
Similar Demographics by College, 1 year or more
Demographics Similar to Creek by College, 1 year or more
In terms of college, 1 year or more, the demographic groups most similar to Creek are Puerto Rican (52.2%, a difference of 0.080%), Central American (52.1%, a difference of 0.14%), Haitian (52.3%, a difference of 0.21%), Seminole (52.1%, a difference of 0.23%), and Choctaw (52.3%, a difference of 0.26%).
| Demographics | Rating | Rank | College, 1 year or more |
| Sioux | 0.0 /100 | #296 | Tragic 53.0% |
| Paiute | 0.0 /100 | #297 | Tragic 52.9% |
| Immigrants | Dominica | 0.0 /100 | #298 | Tragic 52.5% |
| Immigrants | Nicaragua | 0.0 /100 | #299 | Tragic 52.4% |
| Choctaw | 0.0 /100 | #300 | Tragic 52.3% |
| Haitians | 0.0 /100 | #301 | Tragic 52.3% |
| Puerto Ricans | 0.0 /100 | #302 | Tragic 52.2% |
| Creek | 0.0 /100 | #303 | Tragic 52.2% |
| Central Americans | 0.0 /100 | #304 | Tragic 52.1% |
| Seminole | 0.0 /100 | #305 | Tragic 52.1% |
| Mexican American Indians | 0.0 /100 | #306 | Tragic 51.9% |
| Immigrants | Portugal | 0.0 /100 | #307 | Tragic 51.9% |
| Salvadorans | 0.0 /100 | #308 | Tragic 51.8% |
| Apache | 0.0 /100 | #309 | Tragic 51.8% |
| Hondurans | 0.0 /100 | #310 | Tragic 51.6% |
Demographics Similar to South American Indians by College, 1 year or more
In terms of college, 1 year or more, the demographic groups most similar to South American Indians are Immigrants from Iraq (60.0%, a difference of 0.010%), English (60.0%, a difference of 0.020%), Immigrants from Armenia (60.0%, a difference of 0.12%), Somali (59.9%, a difference of 0.14%), and Sudanese (60.2%, a difference of 0.38%).
| Demographics | Rating | Rank | College, 1 year or more |
| Sierra Leoneans | 74.1 /100 | #153 | Good 60.2% |
| Sudanese | 73.0 /100 | #154 | Good 60.2% |
| Moroccans | 72.9 /100 | #155 | Good 60.2% |
| Finns | 72.9 /100 | #156 | Good 60.2% |
| Immigrants | Armenia | 68.8 /100 | #157 | Good 60.0% |
| English | 67.2 /100 | #158 | Good 60.0% |
| Immigrants | Iraq | 67.0 /100 | #159 | Good 60.0% |
| South American Indians | 66.9 /100 | #160 | Good 60.0% |
| Somalis | 64.5 /100 | #161 | Good 59.9% |
| Koreans | 58.5 /100 | #162 | Average 59.7% |
| Immigrants | Somalia | 58.3 /100 | #163 | Average 59.7% |
| Belgians | 58.1 /100 | #164 | Average 59.7% |
| Irish | 56.1 /100 | #165 | Average 59.6% |
| Immigrants | Africa | 56.1 /100 | #166 | Average 59.6% |
| Immigrants | North Macedonia | 53.1 /100 | #167 | Average 59.5% |