Immigrants from France vs Australian College, 1 year or more
COMPARE
Immigrants from France
Australian
College, 1 year or more
College, 1 year or more Comparison
Immigrants from France
Australians
65.8%
COLLEGE, 1 YEAR OR MORE
100.0/ 100
METRIC RATING
28th/ 347
METRIC RANK
64.6%
COLLEGE, 1 YEAR OR MORE
99.9/ 100
METRIC RATING
47th/ 347
METRIC RANK
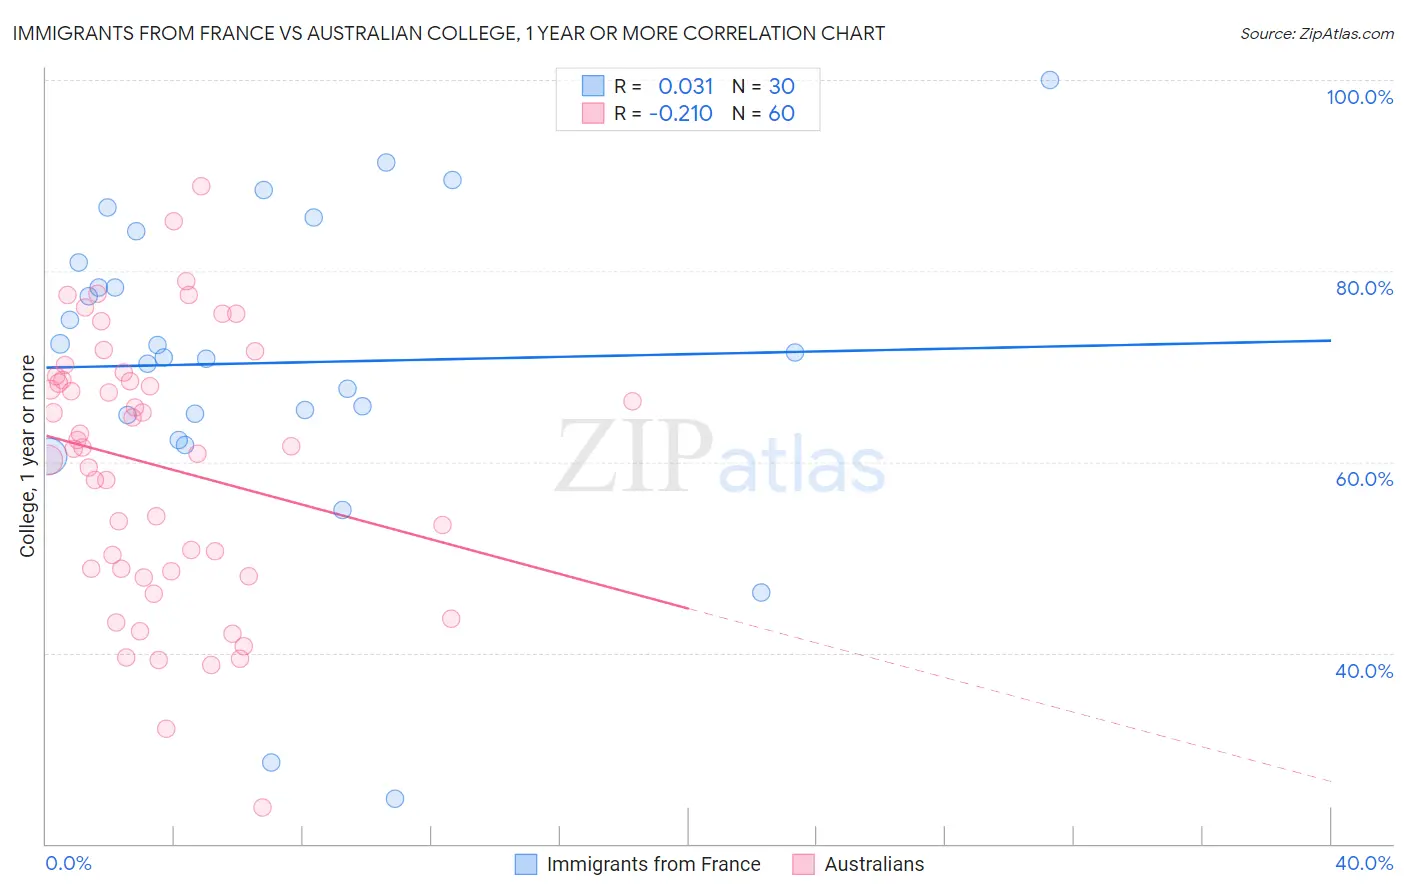
Immigrants from France vs Australian College, 1 year or more Correlation Chart
The statistical analysis conducted on geographies consisting of 287,918,860 people shows no correlation between the proportion of Immigrants from France and percentage of population with at least college, 1 year or more education in the United States with a correlation coefficient (R) of 0.031 and weighted average of 65.8%. Similarly, the statistical analysis conducted on geographies consisting of 224,162,526 people shows a weak negative correlation between the proportion of Australians and percentage of population with at least college, 1 year or more education in the United States with a correlation coefficient (R) of -0.210 and weighted average of 64.6%, a difference of 1.9%.
College, 1 year or more Correlation Summary
| Measurement | Immigrants from France | Australian |
| Minimum | 24.7% | 23.7% |
| Maximum | 100.0% | 88.8% |
| Range | 75.3% | 65.1% |
| Mean | 70.4% | 59.6% |
| Median | 71.2% | 61.6% |
| Interquartile 25% (IQ1) | 64.9% | 48.6% |
| Interquartile 75% (IQ3) | 80.9% | 68.8% |
| Interquartile Range (IQR) | 16.0% | 20.2% |
| Standard Deviation (Sample) | 16.6% | 14.0% |
| Standard Deviation (Population) | 16.3% | 13.8% |
Demographics Similar to Immigrants from France and Australians by College, 1 year or more
In terms of college, 1 year or more, the demographic groups most similar to Immigrants from France are Immigrants from Ireland (65.9%, a difference of 0.17%), Immigrants from Northern Europe (65.6%, a difference of 0.25%), Immigrants from Denmark (65.6%, a difference of 0.36%), Turkish (65.5%, a difference of 0.44%), and Bulgarian (65.5%, a difference of 0.49%). Similarly, the demographic groups most similar to Australians are Bhutanese (64.6%, a difference of 0.010%), Immigrants from Lithuania (64.6%, a difference of 0.020%), Immigrants from Norway (64.7%, a difference of 0.18%), Immigrants from Russia (64.7%, a difference of 0.20%), and Mongolian (64.8%, a difference of 0.33%).
| Demographics | Rating | Rank | College, 1 year or more |
| Immigrants | Ireland | 100.0 /100 | #27 | Exceptional 65.9% |
| Immigrants | France | 100.0 /100 | #28 | Exceptional 65.8% |
| Immigrants | Northern Europe | 100.0 /100 | #29 | Exceptional 65.6% |
| Immigrants | Denmark | 100.0 /100 | #30 | Exceptional 65.6% |
| Turks | 100.0 /100 | #31 | Exceptional 65.5% |
| Bulgarians | 100.0 /100 | #32 | Exceptional 65.5% |
| Immigrants | Sri Lanka | 99.9 /100 | #33 | Exceptional 65.4% |
| Israelis | 99.9 /100 | #34 | Exceptional 65.3% |
| Immigrants | Turkey | 99.9 /100 | #35 | Exceptional 65.2% |
| Immigrants | South Africa | 99.9 /100 | #36 | Exceptional 65.1% |
| Russians | 99.9 /100 | #37 | Exceptional 65.1% |
| Immigrants | Saudi Arabia | 99.9 /100 | #38 | Exceptional 65.0% |
| Estonians | 99.9 /100 | #39 | Exceptional 65.0% |
| Immigrants | Kuwait | 99.9 /100 | #40 | Exceptional 65.0% |
| Mongolians | 99.9 /100 | #41 | Exceptional 64.8% |
| Immigrants | Latvia | 99.9 /100 | #42 | Exceptional 64.8% |
| Immigrants | Russia | 99.9 /100 | #43 | Exceptional 64.7% |
| Immigrants | Norway | 99.9 /100 | #44 | Exceptional 64.7% |
| Immigrants | Lithuania | 99.9 /100 | #45 | Exceptional 64.6% |
| Bhutanese | 99.9 /100 | #46 | Exceptional 64.6% |
| Australians | 99.9 /100 | #47 | Exceptional 64.6% |