Marshallese vs South American Indian College, 1 year or more
COMPARE
Marshallese
South American Indian
College, 1 year or more
College, 1 year or more Comparison
Marshallese
South American Indians
55.8%
COLLEGE, 1 YEAR OR MORE
1.0/ 100
METRIC RATING
242nd/ 347
METRIC RANK
60.0%
COLLEGE, 1 YEAR OR MORE
66.9/ 100
METRIC RATING
160th/ 347
METRIC RANK
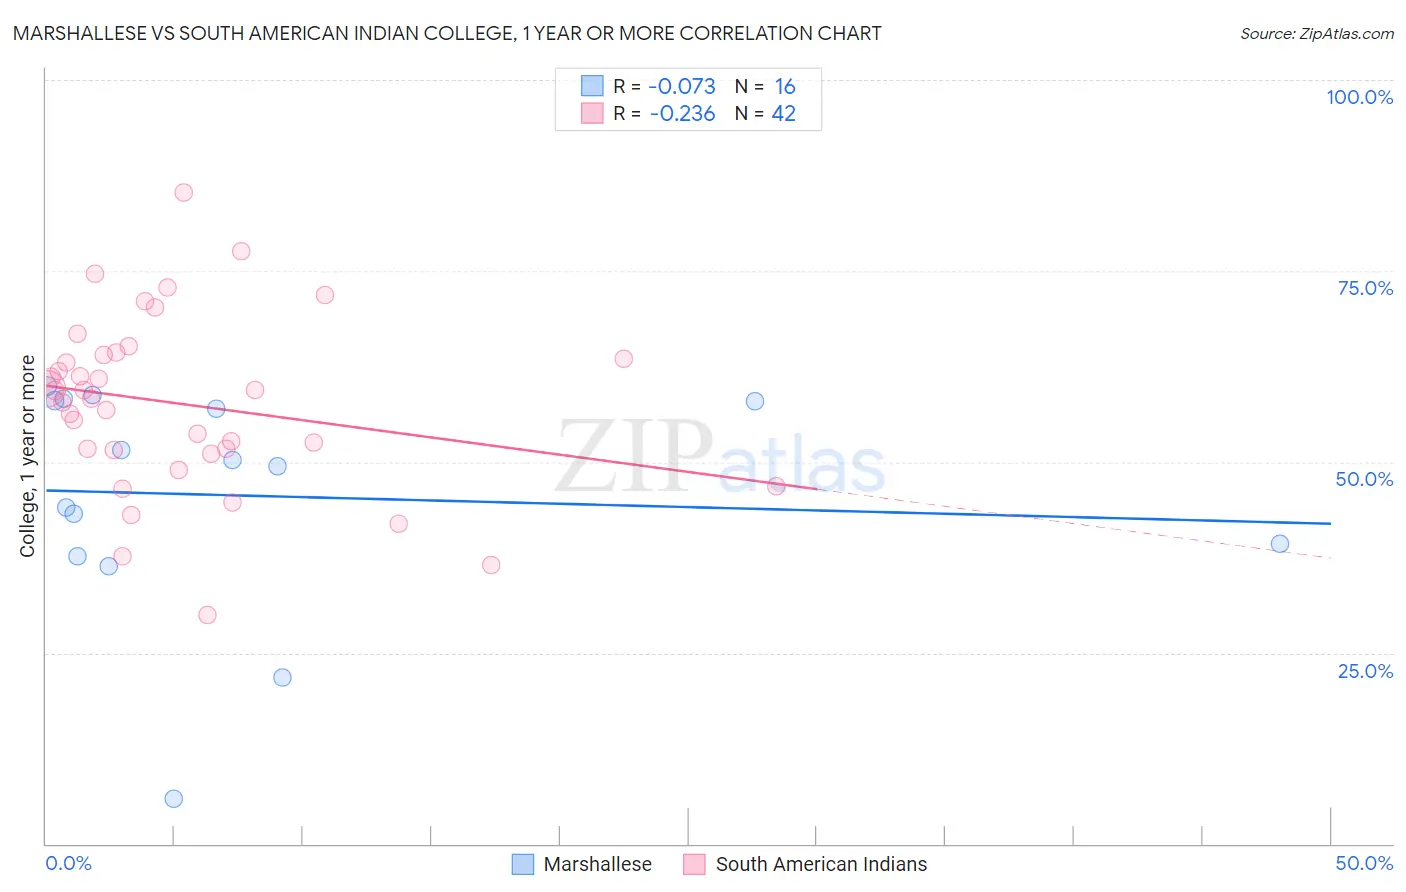
Marshallese vs South American Indian College, 1 year or more Correlation Chart
The statistical analysis conducted on geographies consisting of 14,761,315 people shows a slight negative correlation between the proportion of Marshallese and percentage of population with at least college, 1 year or more education in the United States with a correlation coefficient (R) of -0.073 and weighted average of 55.8%. Similarly, the statistical analysis conducted on geographies consisting of 164,573,280 people shows a weak negative correlation between the proportion of South American Indians and percentage of population with at least college, 1 year or more education in the United States with a correlation coefficient (R) of -0.236 and weighted average of 60.0%, a difference of 7.5%.
College, 1 year or more Correlation Summary
| Measurement | Marshallese | South American Indian |
| Minimum | 5.9% | 30.0% |
| Maximum | 60.0% | 85.2% |
| Range | 54.1% | 55.2% |
| Mean | 45.6% | 57.6% |
| Median | 49.9% | 58.8% |
| Interquartile 25% (IQ1) | 38.5% | 51.6% |
| Interquartile 75% (IQ3) | 58.0% | 63.9% |
| Interquartile Range (IQR) | 19.5% | 12.3% |
| Standard Deviation (Sample) | 15.0% | 11.4% |
| Standard Deviation (Population) | 14.6% | 11.3% |
Similar Demographics by College, 1 year or more
Demographics Similar to Marshallese by College, 1 year or more
In terms of college, 1 year or more, the demographic groups most similar to Marshallese are Osage (55.8%, a difference of 0.010%), French American Indian (55.8%, a difference of 0.11%), Chippewa (55.7%, a difference of 0.13%), Trinidadian and Tobagonian (55.8%, a difference of 0.15%), and Immigrants from Liberia (55.7%, a difference of 0.20%).
| Demographics | Rating | Rank | College, 1 year or more |
| West Indians | 1.8 /100 | #235 | Tragic 56.3% |
| Iroquois | 1.7 /100 | #236 | Tragic 56.2% |
| Samoans | 1.6 /100 | #237 | Tragic 56.2% |
| Barbadians | 1.3 /100 | #238 | Tragic 56.0% |
| Puget Sound Salish | 1.1 /100 | #239 | Tragic 55.9% |
| Trinidadians and Tobagonians | 1.1 /100 | #240 | Tragic 55.8% |
| French American Indians | 1.0 /100 | #241 | Tragic 55.8% |
| Marshallese | 1.0 /100 | #242 | Tragic 55.8% |
| Osage | 1.0 /100 | #243 | Tragic 55.8% |
| Chippewa | 0.9 /100 | #244 | Tragic 55.7% |
| Immigrants | Liberia | 0.8 /100 | #245 | Tragic 55.7% |
| Malaysians | 0.8 /100 | #246 | Tragic 55.6% |
| Hawaiians | 0.8 /100 | #247 | Tragic 55.6% |
| Immigrants | Congo | 0.8 /100 | #248 | Tragic 55.6% |
| Immigrants | Trinidad and Tobago | 0.7 /100 | #249 | Tragic 55.5% |
Demographics Similar to South American Indians by College, 1 year or more
In terms of college, 1 year or more, the demographic groups most similar to South American Indians are Immigrants from Iraq (60.0%, a difference of 0.010%), English (60.0%, a difference of 0.020%), Immigrants from Armenia (60.0%, a difference of 0.12%), Somali (59.9%, a difference of 0.14%), and Sudanese (60.2%, a difference of 0.38%).
| Demographics | Rating | Rank | College, 1 year or more |
| Sierra Leoneans | 74.1 /100 | #153 | Good 60.2% |
| Sudanese | 73.0 /100 | #154 | Good 60.2% |
| Moroccans | 72.9 /100 | #155 | Good 60.2% |
| Finns | 72.9 /100 | #156 | Good 60.2% |
| Immigrants | Armenia | 68.8 /100 | #157 | Good 60.0% |
| English | 67.2 /100 | #158 | Good 60.0% |
| Immigrants | Iraq | 67.0 /100 | #159 | Good 60.0% |
| South American Indians | 66.9 /100 | #160 | Good 60.0% |
| Somalis | 64.5 /100 | #161 | Good 59.9% |
| Koreans | 58.5 /100 | #162 | Average 59.7% |
| Immigrants | Somalia | 58.3 /100 | #163 | Average 59.7% |
| Belgians | 58.1 /100 | #164 | Average 59.7% |
| Irish | 56.1 /100 | #165 | Average 59.6% |
| Immigrants | Africa | 56.1 /100 | #166 | Average 59.6% |
| Immigrants | North Macedonia | 53.1 /100 | #167 | Average 59.5% |