Immigrants from France vs Central American College, 1 year or more
COMPARE
Immigrants from France
Central American
College, 1 year or more
College, 1 year or more Comparison
Immigrants from France
Central Americans
65.8%
COLLEGE, 1 YEAR OR MORE
100.0/ 100
METRIC RATING
28th/ 347
METRIC RANK
52.1%
COLLEGE, 1 YEAR OR MORE
0.0/ 100
METRIC RATING
304th/ 347
METRIC RANK
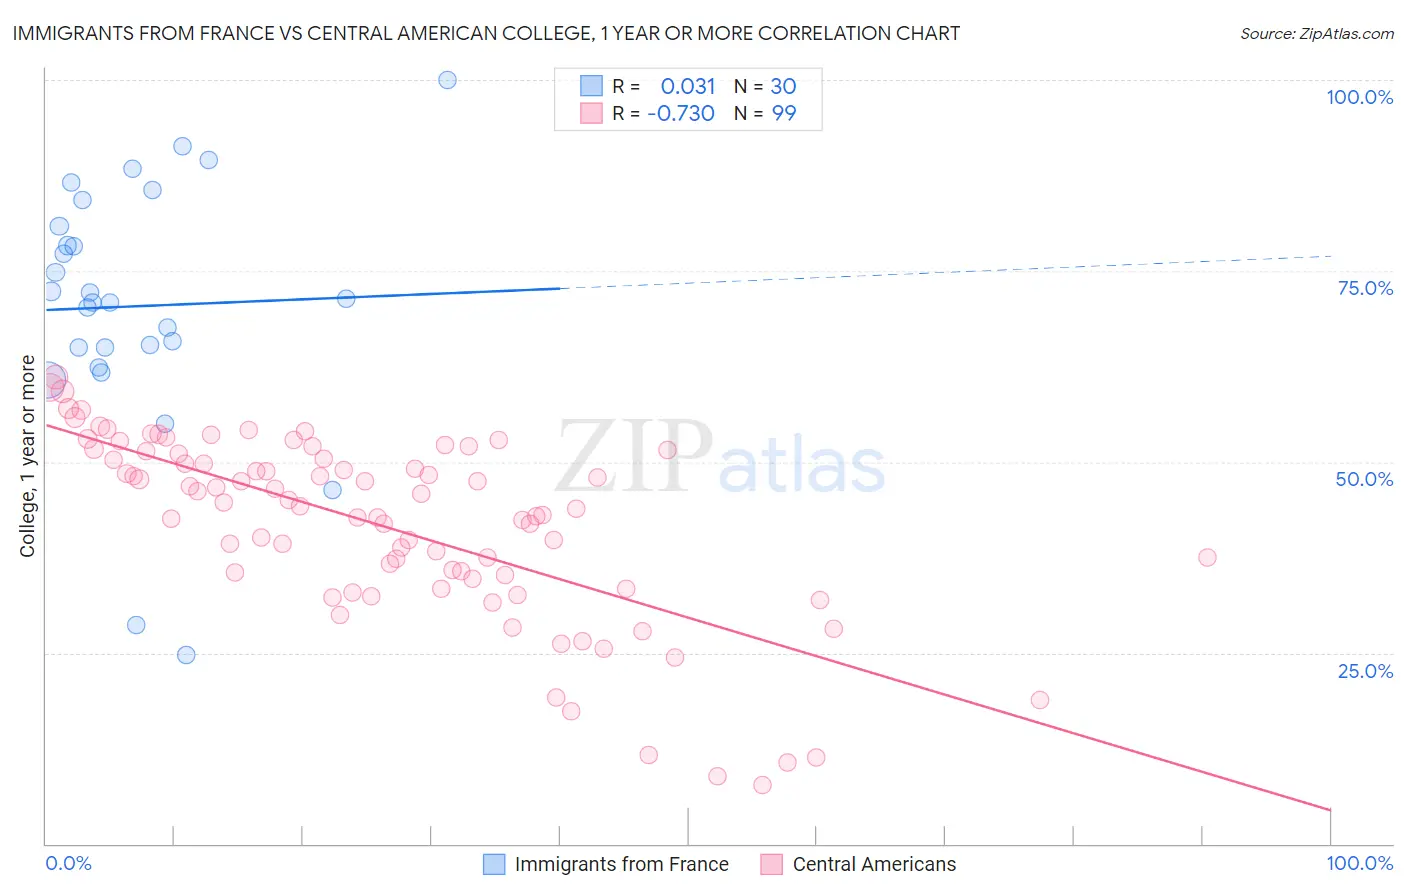
Immigrants from France vs Central American College, 1 year or more Correlation Chart
The statistical analysis conducted on geographies consisting of 287,918,860 people shows no correlation between the proportion of Immigrants from France and percentage of population with at least college, 1 year or more education in the United States with a correlation coefficient (R) of 0.031 and weighted average of 65.8%. Similarly, the statistical analysis conducted on geographies consisting of 504,614,076 people shows a strong negative correlation between the proportion of Central Americans and percentage of population with at least college, 1 year or more education in the United States with a correlation coefficient (R) of -0.730 and weighted average of 52.1%, a difference of 26.3%.
College, 1 year or more Correlation Summary
| Measurement | Immigrants from France | Central American |
| Minimum | 24.7% | 7.7% |
| Maximum | 100.0% | 61.1% |
| Range | 75.3% | 53.4% |
| Mean | 70.4% | 41.6% |
| Median | 71.2% | 44.2% |
| Interquartile 25% (IQ1) | 64.9% | 34.7% |
| Interquartile 75% (IQ3) | 80.9% | 51.0% |
| Interquartile Range (IQR) | 16.0% | 16.4% |
| Standard Deviation (Sample) | 16.6% | 12.1% |
| Standard Deviation (Population) | 16.3% | 12.1% |
Similar Demographics by College, 1 year or more
Demographics Similar to Immigrants from France by College, 1 year or more
In terms of college, 1 year or more, the demographic groups most similar to Immigrants from France are Immigrants from Ireland (65.9%, a difference of 0.17%), Immigrants from Northern Europe (65.6%, a difference of 0.25%), Immigrants from Denmark (65.6%, a difference of 0.36%), Latvian (66.1%, a difference of 0.37%), and Indian (Asian) (66.1%, a difference of 0.41%).
| Demographics | Rating | Rank | College, 1 year or more |
| Immigrants | Hong Kong | 100.0 /100 | #21 | Exceptional 66.4% |
| Soviet Union | 100.0 /100 | #22 | Exceptional 66.4% |
| Immigrants | China | 100.0 /100 | #23 | Exceptional 66.4% |
| Immigrants | Belgium | 100.0 /100 | #24 | Exceptional 66.3% |
| Indians (Asian) | 100.0 /100 | #25 | Exceptional 66.1% |
| Latvians | 100.0 /100 | #26 | Exceptional 66.1% |
| Immigrants | Ireland | 100.0 /100 | #27 | Exceptional 65.9% |
| Immigrants | France | 100.0 /100 | #28 | Exceptional 65.8% |
| Immigrants | Northern Europe | 100.0 /100 | #29 | Exceptional 65.6% |
| Immigrants | Denmark | 100.0 /100 | #30 | Exceptional 65.6% |
| Turks | 100.0 /100 | #31 | Exceptional 65.5% |
| Bulgarians | 100.0 /100 | #32 | Exceptional 65.5% |
| Immigrants | Sri Lanka | 99.9 /100 | #33 | Exceptional 65.4% |
| Israelis | 99.9 /100 | #34 | Exceptional 65.3% |
| Immigrants | Turkey | 99.9 /100 | #35 | Exceptional 65.2% |
Demographics Similar to Central Americans by College, 1 year or more
In terms of college, 1 year or more, the demographic groups most similar to Central Americans are Seminole (52.1%, a difference of 0.10%), Creek (52.2%, a difference of 0.14%), Puerto Rican (52.2%, a difference of 0.21%), Haitian (52.3%, a difference of 0.34%), and Choctaw (52.3%, a difference of 0.40%).
| Demographics | Rating | Rank | College, 1 year or more |
| Paiute | 0.0 /100 | #297 | Tragic 52.9% |
| Immigrants | Dominica | 0.0 /100 | #298 | Tragic 52.5% |
| Immigrants | Nicaragua | 0.0 /100 | #299 | Tragic 52.4% |
| Choctaw | 0.0 /100 | #300 | Tragic 52.3% |
| Haitians | 0.0 /100 | #301 | Tragic 52.3% |
| Puerto Ricans | 0.0 /100 | #302 | Tragic 52.2% |
| Creek | 0.0 /100 | #303 | Tragic 52.2% |
| Central Americans | 0.0 /100 | #304 | Tragic 52.1% |
| Seminole | 0.0 /100 | #305 | Tragic 52.1% |
| Mexican American Indians | 0.0 /100 | #306 | Tragic 51.9% |
| Immigrants | Portugal | 0.0 /100 | #307 | Tragic 51.9% |
| Salvadorans | 0.0 /100 | #308 | Tragic 51.8% |
| Apache | 0.0 /100 | #309 | Tragic 51.8% |
| Hondurans | 0.0 /100 | #310 | Tragic 51.6% |
| Immigrants | Haiti | 0.0 /100 | #311 | Tragic 51.5% |