Immigrants from France vs Immigrants from Latin America College, 1 year or more
COMPARE
Immigrants from France
Immigrants from Latin America
College, 1 year or more
College, 1 year or more Comparison
Immigrants from France
Immigrants from Latin America
65.8%
COLLEGE, 1 YEAR OR MORE
100.0/ 100
METRIC RATING
28th/ 347
METRIC RANK
50.7%
COLLEGE, 1 YEAR OR MORE
0.0/ 100
METRIC RATING
325th/ 347
METRIC RANK
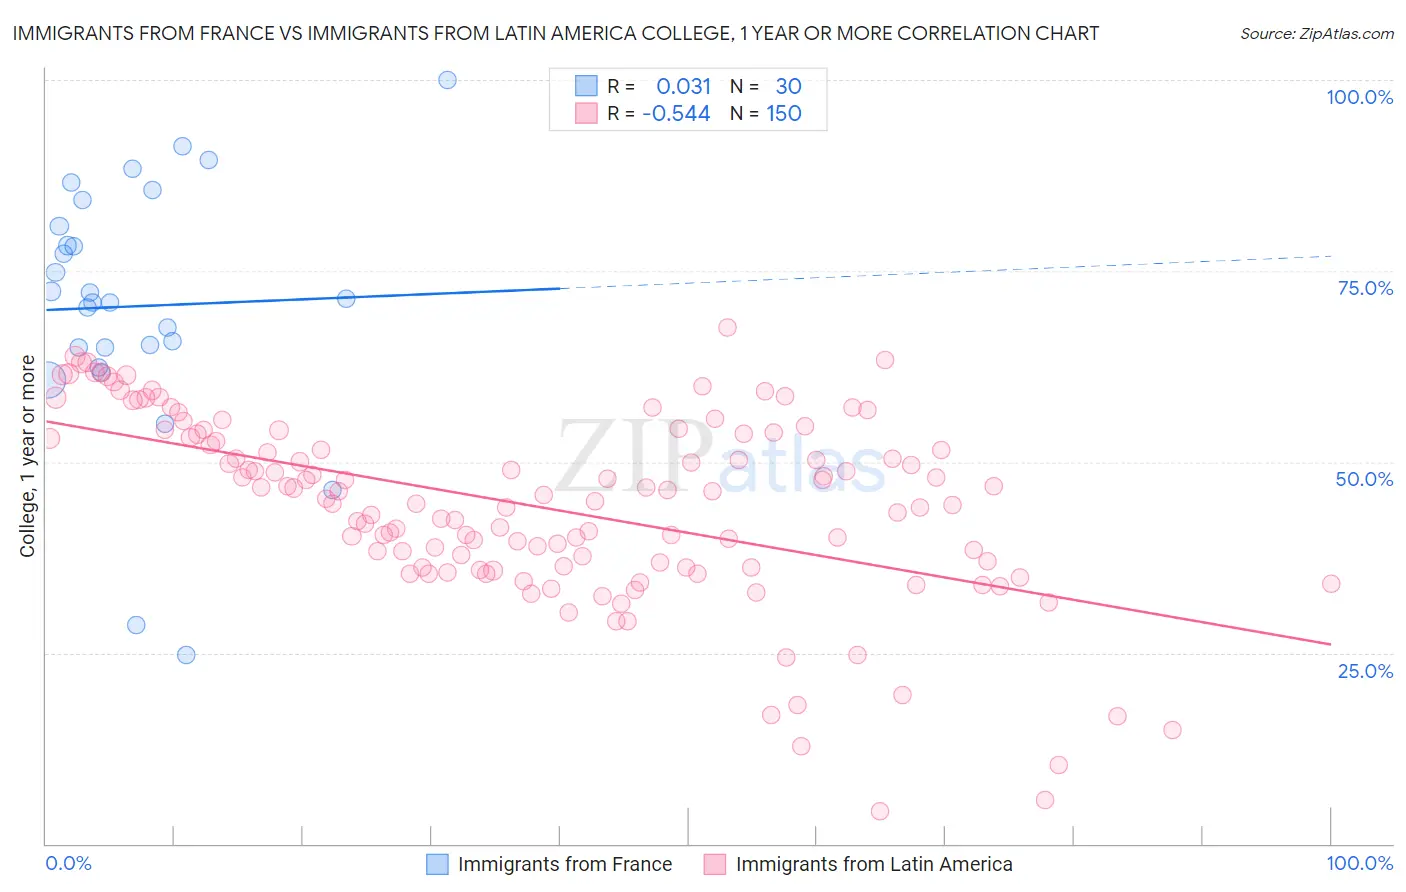
Immigrants from France vs Immigrants from Latin America College, 1 year or more Correlation Chart
The statistical analysis conducted on geographies consisting of 287,918,860 people shows no correlation between the proportion of Immigrants from France and percentage of population with at least college, 1 year or more education in the United States with a correlation coefficient (R) of 0.031 and weighted average of 65.8%. Similarly, the statistical analysis conducted on geographies consisting of 558,635,487 people shows a substantial negative correlation between the proportion of Immigrants from Latin America and percentage of population with at least college, 1 year or more education in the United States with a correlation coefficient (R) of -0.544 and weighted average of 50.7%, a difference of 29.9%.
College, 1 year or more Correlation Summary
| Measurement | Immigrants from France | Immigrants from Latin America |
| Minimum | 24.7% | 4.2% |
| Maximum | 100.0% | 67.7% |
| Range | 75.3% | 63.5% |
| Mean | 70.4% | 44.2% |
| Median | 71.2% | 45.4% |
| Interquartile 25% (IQ1) | 64.9% | 36.2% |
| Interquartile 75% (IQ3) | 80.9% | 53.6% |
| Interquartile Range (IQR) | 16.0% | 17.4% |
| Standard Deviation (Sample) | 16.6% | 12.3% |
| Standard Deviation (Population) | 16.3% | 12.2% |
Similar Demographics by College, 1 year or more
Demographics Similar to Immigrants from France by College, 1 year or more
In terms of college, 1 year or more, the demographic groups most similar to Immigrants from France are Immigrants from Ireland (65.9%, a difference of 0.17%), Immigrants from Northern Europe (65.6%, a difference of 0.25%), Immigrants from Denmark (65.6%, a difference of 0.36%), Latvian (66.1%, a difference of 0.37%), and Indian (Asian) (66.1%, a difference of 0.41%).
| Demographics | Rating | Rank | College, 1 year or more |
| Immigrants | Hong Kong | 100.0 /100 | #21 | Exceptional 66.4% |
| Soviet Union | 100.0 /100 | #22 | Exceptional 66.4% |
| Immigrants | China | 100.0 /100 | #23 | Exceptional 66.4% |
| Immigrants | Belgium | 100.0 /100 | #24 | Exceptional 66.3% |
| Indians (Asian) | 100.0 /100 | #25 | Exceptional 66.1% |
| Latvians | 100.0 /100 | #26 | Exceptional 66.1% |
| Immigrants | Ireland | 100.0 /100 | #27 | Exceptional 65.9% |
| Immigrants | France | 100.0 /100 | #28 | Exceptional 65.8% |
| Immigrants | Northern Europe | 100.0 /100 | #29 | Exceptional 65.6% |
| Immigrants | Denmark | 100.0 /100 | #30 | Exceptional 65.6% |
| Turks | 100.0 /100 | #31 | Exceptional 65.5% |
| Bulgarians | 100.0 /100 | #32 | Exceptional 65.5% |
| Immigrants | Sri Lanka | 99.9 /100 | #33 | Exceptional 65.4% |
| Israelis | 99.9 /100 | #34 | Exceptional 65.3% |
| Immigrants | Turkey | 99.9 /100 | #35 | Exceptional 65.2% |
Demographics Similar to Immigrants from Latin America by College, 1 year or more
In terms of college, 1 year or more, the demographic groups most similar to Immigrants from Latin America are Immigrants from Cuba (50.7%, a difference of 0.030%), Immigrants from Guatemala (50.7%, a difference of 0.040%), Dominican (50.6%, a difference of 0.18%), Menominee (50.6%, a difference of 0.22%), and Navajo (50.8%, a difference of 0.27%).
| Demographics | Rating | Rank | College, 1 year or more |
| Immigrants | Honduras | 0.0 /100 | #318 | Tragic 51.0% |
| Immigrants | El Salvador | 0.0 /100 | #319 | Tragic 51.0% |
| Kiowa | 0.0 /100 | #320 | Tragic 51.0% |
| Hopi | 0.0 /100 | #321 | Tragic 50.9% |
| Navajo | 0.0 /100 | #322 | Tragic 50.8% |
| Immigrants | Guatemala | 0.0 /100 | #323 | Tragic 50.7% |
| Immigrants | Cuba | 0.0 /100 | #324 | Tragic 50.7% |
| Immigrants | Latin America | 0.0 /100 | #325 | Tragic 50.7% |
| Dominicans | 0.0 /100 | #326 | Tragic 50.6% |
| Menominee | 0.0 /100 | #327 | Tragic 50.6% |
| Dutch West Indians | 0.0 /100 | #328 | Tragic 50.5% |
| Cape Verdeans | 0.0 /100 | #329 | Tragic 50.3% |
| Natives/Alaskans | 0.0 /100 | #330 | Tragic 50.2% |
| Immigrants | Yemen | 0.0 /100 | #331 | Tragic 50.0% |
| Mexicans | 0.0 /100 | #332 | Tragic 49.2% |