Immigrants from Canada vs Central American College, 1 year or more
COMPARE
Immigrants from Canada
Central American
College, 1 year or more
College, 1 year or more Comparison
Immigrants from Canada
Central Americans
63.1%
COLLEGE, 1 YEAR OR MORE
99.1/ 100
METRIC RATING
71st/ 347
METRIC RANK
52.1%
COLLEGE, 1 YEAR OR MORE
0.0/ 100
METRIC RATING
304th/ 347
METRIC RANK
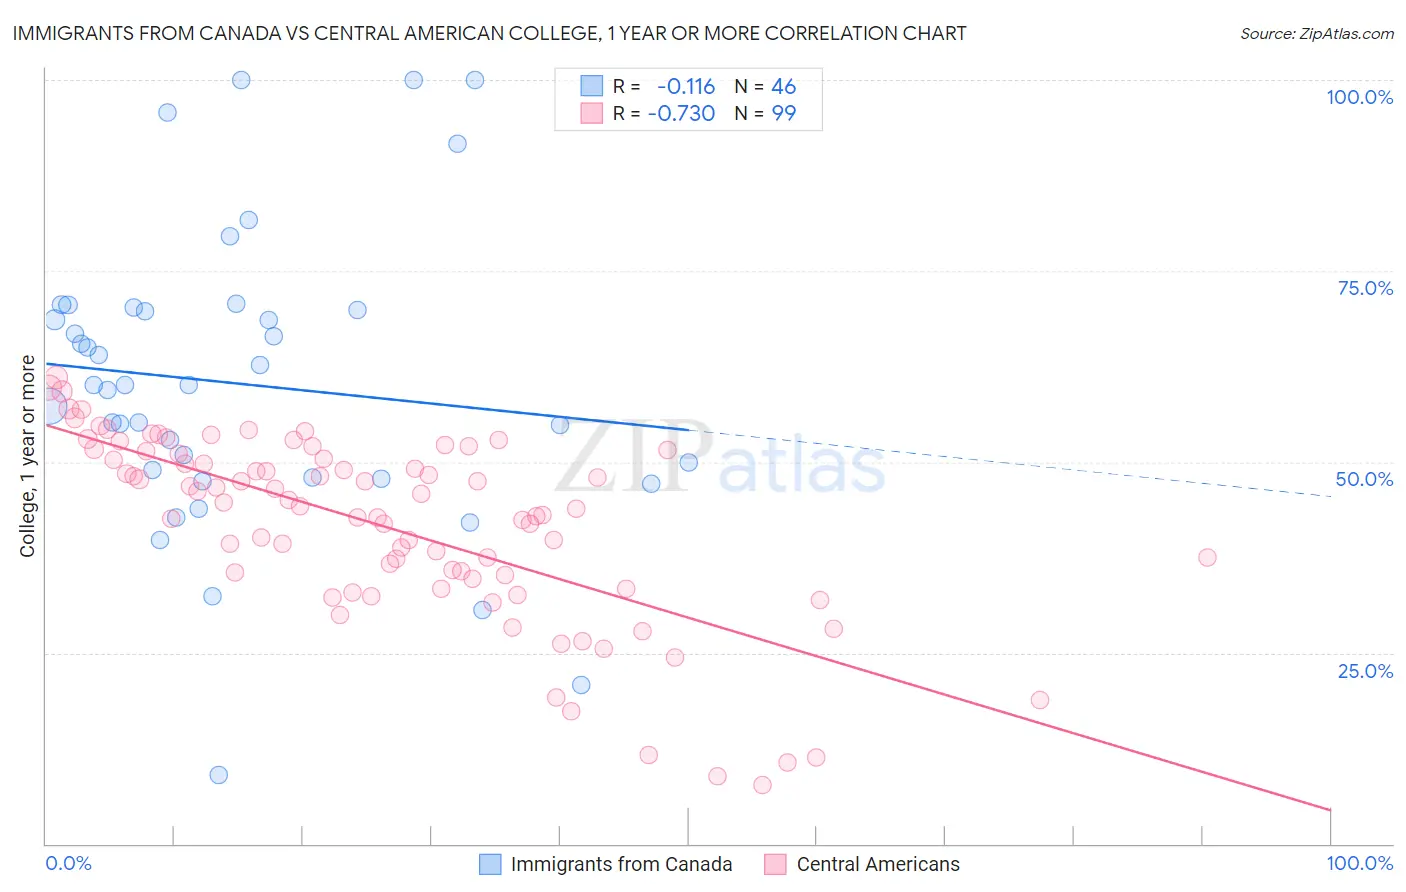
Immigrants from Canada vs Central American College, 1 year or more Correlation Chart
The statistical analysis conducted on geographies consisting of 459,391,400 people shows a poor negative correlation between the proportion of Immigrants from Canada and percentage of population with at least college, 1 year or more education in the United States with a correlation coefficient (R) of -0.116 and weighted average of 63.1%. Similarly, the statistical analysis conducted on geographies consisting of 504,614,076 people shows a strong negative correlation between the proportion of Central Americans and percentage of population with at least college, 1 year or more education in the United States with a correlation coefficient (R) of -0.730 and weighted average of 52.1%, a difference of 21.0%.
College, 1 year or more Correlation Summary
| Measurement | Immigrants from Canada | Central American |
| Minimum | 9.0% | 7.7% |
| Maximum | 100.0% | 61.1% |
| Range | 91.0% | 53.4% |
| Mean | 60.2% | 41.6% |
| Median | 60.0% | 44.2% |
| Interquartile 25% (IQ1) | 47.9% | 34.7% |
| Interquartile 75% (IQ3) | 69.9% | 51.0% |
| Interquartile Range (IQR) | 22.0% | 16.4% |
| Standard Deviation (Sample) | 19.5% | 12.1% |
| Standard Deviation (Population) | 19.2% | 12.1% |
Similar Demographics by College, 1 year or more
Demographics Similar to Immigrants from Canada by College, 1 year or more
In terms of college, 1 year or more, the demographic groups most similar to Immigrants from Canada are Egyptian (63.1%, a difference of 0.060%), Immigrants from Moldova (63.0%, a difference of 0.070%), Immigrants from North America (63.0%, a difference of 0.080%), Armenian (63.0%, a difference of 0.17%), and Argentinean (63.2%, a difference of 0.18%).
| Demographics | Rating | Rank | College, 1 year or more |
| Immigrants | Spain | 99.4 /100 | #64 | Exceptional 63.4% |
| Maltese | 99.3 /100 | #65 | Exceptional 63.4% |
| Immigrants | Europe | 99.3 /100 | #66 | Exceptional 63.3% |
| Immigrants | Romania | 99.3 /100 | #67 | Exceptional 63.3% |
| Immigrants | Greece | 99.3 /100 | #68 | Exceptional 63.3% |
| Immigrants | Zimbabwe | 99.3 /100 | #69 | Exceptional 63.3% |
| Argentineans | 99.2 /100 | #70 | Exceptional 63.2% |
| Immigrants | Canada | 99.1 /100 | #71 | Exceptional 63.1% |
| Egyptians | 99.0 /100 | #72 | Exceptional 63.1% |
| Immigrants | Moldova | 99.0 /100 | #73 | Exceptional 63.0% |
| Immigrants | North America | 99.0 /100 | #74 | Exceptional 63.0% |
| Armenians | 98.9 /100 | #75 | Exceptional 63.0% |
| Paraguayans | 98.8 /100 | #76 | Exceptional 62.9% |
| Ethiopians | 98.8 /100 | #77 | Exceptional 62.9% |
| Immigrants | Lebanon | 98.8 /100 | #78 | Exceptional 62.9% |
Demographics Similar to Central Americans by College, 1 year or more
In terms of college, 1 year or more, the demographic groups most similar to Central Americans are Seminole (52.1%, a difference of 0.10%), Creek (52.2%, a difference of 0.14%), Puerto Rican (52.2%, a difference of 0.21%), Haitian (52.3%, a difference of 0.34%), and Choctaw (52.3%, a difference of 0.40%).
| Demographics | Rating | Rank | College, 1 year or more |
| Paiute | 0.0 /100 | #297 | Tragic 52.9% |
| Immigrants | Dominica | 0.0 /100 | #298 | Tragic 52.5% |
| Immigrants | Nicaragua | 0.0 /100 | #299 | Tragic 52.4% |
| Choctaw | 0.0 /100 | #300 | Tragic 52.3% |
| Haitians | 0.0 /100 | #301 | Tragic 52.3% |
| Puerto Ricans | 0.0 /100 | #302 | Tragic 52.2% |
| Creek | 0.0 /100 | #303 | Tragic 52.2% |
| Central Americans | 0.0 /100 | #304 | Tragic 52.1% |
| Seminole | 0.0 /100 | #305 | Tragic 52.1% |
| Mexican American Indians | 0.0 /100 | #306 | Tragic 51.9% |
| Immigrants | Portugal | 0.0 /100 | #307 | Tragic 51.9% |
| Salvadorans | 0.0 /100 | #308 | Tragic 51.8% |
| Apache | 0.0 /100 | #309 | Tragic 51.8% |
| Hondurans | 0.0 /100 | #310 | Tragic 51.6% |
| Immigrants | Haiti | 0.0 /100 | #311 | Tragic 51.5% |