Immigrants from Syria vs Central American College, 1 year or more
COMPARE
Immigrants from Syria
Central American
College, 1 year or more
College, 1 year or more Comparison
Immigrants from Syria
Central Americans
61.3%
COLLEGE, 1 YEAR OR MORE
91.6/ 100
METRIC RATING
125th/ 347
METRIC RANK
52.1%
COLLEGE, 1 YEAR OR MORE
0.0/ 100
METRIC RATING
304th/ 347
METRIC RANK
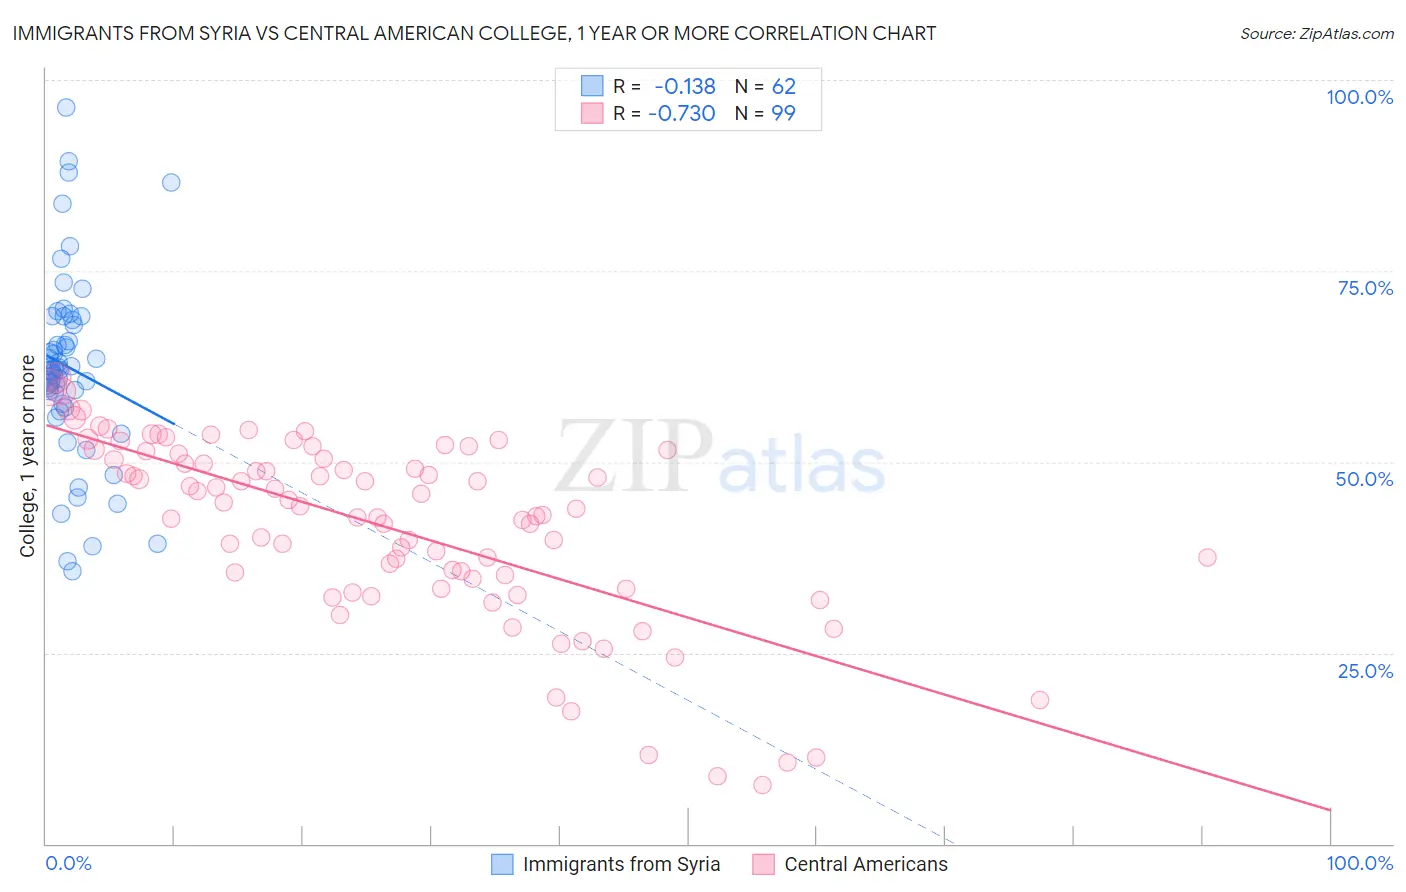
Immigrants from Syria vs Central American College, 1 year or more Correlation Chart
The statistical analysis conducted on geographies consisting of 174,109,130 people shows a poor negative correlation between the proportion of Immigrants from Syria and percentage of population with at least college, 1 year or more education in the United States with a correlation coefficient (R) of -0.138 and weighted average of 61.3%. Similarly, the statistical analysis conducted on geographies consisting of 504,614,076 people shows a strong negative correlation between the proportion of Central Americans and percentage of population with at least college, 1 year or more education in the United States with a correlation coefficient (R) of -0.730 and weighted average of 52.1%, a difference of 17.6%.
College, 1 year or more Correlation Summary
| Measurement | Immigrants from Syria | Central American |
| Minimum | 35.7% | 7.7% |
| Maximum | 96.4% | 61.1% |
| Range | 60.7% | 53.4% |
| Mean | 62.3% | 41.6% |
| Median | 62.1% | 44.2% |
| Interquartile 25% (IQ1) | 57.5% | 34.7% |
| Interquartile 75% (IQ3) | 68.5% | 51.0% |
| Interquartile Range (IQR) | 11.0% | 16.4% |
| Standard Deviation (Sample) | 12.2% | 12.1% |
| Standard Deviation (Population) | 12.1% | 12.1% |
Similar Demographics by College, 1 year or more
Demographics Similar to Immigrants from Syria by College, 1 year or more
In terms of college, 1 year or more, the demographic groups most similar to Immigrants from Syria are Alsatian (61.3%, a difference of 0.050%), Immigrants from Eastern Africa (61.2%, a difference of 0.070%), Venezuelan (61.3%, a difference of 0.080%), Immigrants from Italy (61.2%, a difference of 0.080%), and Serbian (61.4%, a difference of 0.11%).
| Demographics | Rating | Rank | College, 1 year or more |
| Immigrants | Brazil | 93.9 /100 | #118 | Exceptional 61.6% |
| Assyrians/Chaldeans/Syriacs | 93.3 /100 | #119 | Exceptional 61.5% |
| Pakistanis | 93.2 /100 | #120 | Exceptional 61.5% |
| Immigrants | Jordan | 92.7 /100 | #121 | Exceptional 61.4% |
| Immigrants | Chile | 92.3 /100 | #122 | Exceptional 61.4% |
| Serbians | 92.2 /100 | #123 | Exceptional 61.4% |
| Venezuelans | 92.1 /100 | #124 | Exceptional 61.3% |
| Immigrants | Syria | 91.6 /100 | #125 | Exceptional 61.3% |
| Alsatians | 91.3 /100 | #126 | Exceptional 61.3% |
| Immigrants | Eastern Africa | 91.1 /100 | #127 | Exceptional 61.2% |
| Immigrants | Italy | 91.1 /100 | #128 | Exceptional 61.2% |
| Ugandans | 90.7 /100 | #129 | Exceptional 61.2% |
| Italians | 89.5 /100 | #130 | Excellent 61.1% |
| Immigrants | Morocco | 89.5 /100 | #131 | Excellent 61.1% |
| Scandinavians | 88.2 /100 | #132 | Excellent 61.0% |
Demographics Similar to Central Americans by College, 1 year or more
In terms of college, 1 year or more, the demographic groups most similar to Central Americans are Seminole (52.1%, a difference of 0.10%), Creek (52.2%, a difference of 0.14%), Puerto Rican (52.2%, a difference of 0.21%), Haitian (52.3%, a difference of 0.34%), and Choctaw (52.3%, a difference of 0.40%).
| Demographics | Rating | Rank | College, 1 year or more |
| Paiute | 0.0 /100 | #297 | Tragic 52.9% |
| Immigrants | Dominica | 0.0 /100 | #298 | Tragic 52.5% |
| Immigrants | Nicaragua | 0.0 /100 | #299 | Tragic 52.4% |
| Choctaw | 0.0 /100 | #300 | Tragic 52.3% |
| Haitians | 0.0 /100 | #301 | Tragic 52.3% |
| Puerto Ricans | 0.0 /100 | #302 | Tragic 52.2% |
| Creek | 0.0 /100 | #303 | Tragic 52.2% |
| Central Americans | 0.0 /100 | #304 | Tragic 52.1% |
| Seminole | 0.0 /100 | #305 | Tragic 52.1% |
| Mexican American Indians | 0.0 /100 | #306 | Tragic 51.9% |
| Immigrants | Portugal | 0.0 /100 | #307 | Tragic 51.9% |
| Salvadorans | 0.0 /100 | #308 | Tragic 51.8% |
| Apache | 0.0 /100 | #309 | Tragic 51.8% |
| Hondurans | 0.0 /100 | #310 | Tragic 51.6% |
| Immigrants | Haiti | 0.0 /100 | #311 | Tragic 51.5% |