Immigrants from Europe vs Yakama College, Under 1 year
COMPARE
Immigrants from Europe
Yakama
College, Under 1 year
College, Under 1 year Comparison
Immigrants from Europe
Yakama
68.8%
COLLEGE, UNDER 1 YEAR
99.1/ 100
METRIC RATING
71st/ 347
METRIC RANK
52.6%
COLLEGE, UNDER 1 YEAR
0.0/ 100
METRIC RATING
344th/ 347
METRIC RANK
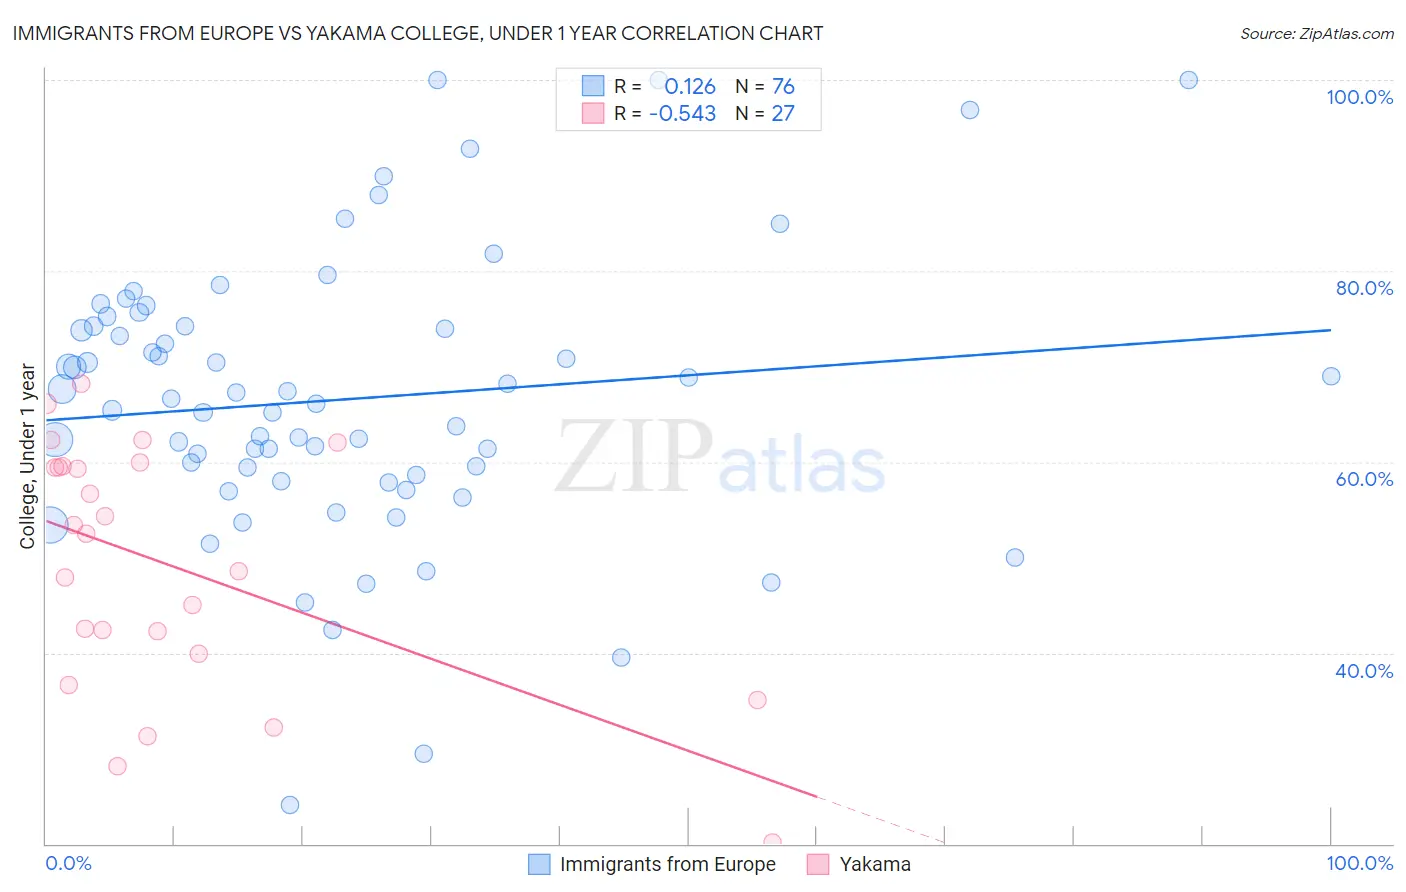
Immigrants from Europe vs Yakama College, Under 1 year Correlation Chart
The statistical analysis conducted on geographies consisting of 547,420,628 people shows a poor positive correlation between the proportion of Immigrants from Europe and percentage of population with at least college, under 1 year education in the United States with a correlation coefficient (R) of 0.126 and weighted average of 68.8%. Similarly, the statistical analysis conducted on geographies consisting of 19,923,144 people shows a substantial negative correlation between the proportion of Yakama and percentage of population with at least college, under 1 year education in the United States with a correlation coefficient (R) of -0.543 and weighted average of 52.6%, a difference of 30.7%.
College, Under 1 year Correlation Summary
| Measurement | Immigrants from Europe | Yakama |
| Minimum | 24.0% | 20.2% |
| Maximum | 100.0% | 68.2% |
| Range | 76.0% | 48.1% |
| Mean | 66.5% | 49.2% |
| Median | 66.3% | 52.5% |
| Interquartile 25% (IQ1) | 58.3% | 40.0% |
| Interquartile 75% (IQ3) | 74.2% | 59.5% |
| Interquartile Range (IQR) | 16.0% | 19.6% |
| Standard Deviation (Sample) | 14.7% | 12.8% |
| Standard Deviation (Population) | 14.6% | 12.6% |
Similar Demographics by College, Under 1 year
Demographics Similar to Immigrants from Europe by College, Under 1 year
In terms of college, under 1 year, the demographic groups most similar to Immigrants from Europe are Lithuanian (68.8%, a difference of 0.010%), Bolivian (68.7%, a difference of 0.040%), Immigrants from England (68.7%, a difference of 0.080%), Swedish (68.7%, a difference of 0.14%), and Immigrants from Romania (68.9%, a difference of 0.18%).
| Demographics | Rating | Rank | College, Under 1 year |
| Northern Europeans | 99.4 /100 | #64 | Exceptional 69.0% |
| Immigrants | Moldova | 99.3 /100 | #65 | Exceptional 69.0% |
| Immigrants | North America | 99.3 /100 | #66 | Exceptional 69.0% |
| Immigrants | Zimbabwe | 99.2 /100 | #67 | Exceptional 68.9% |
| Immigrants | Indonesia | 99.2 /100 | #68 | Exceptional 68.9% |
| Immigrants | Romania | 99.2 /100 | #69 | Exceptional 68.9% |
| Lithuanians | 99.1 /100 | #70 | Exceptional 68.8% |
| Immigrants | Europe | 99.1 /100 | #71 | Exceptional 68.8% |
| Bolivians | 99.0 /100 | #72 | Exceptional 68.7% |
| Immigrants | England | 99.0 /100 | #73 | Exceptional 68.7% |
| Swedes | 98.9 /100 | #74 | Exceptional 68.7% |
| Immigrants | Western Europe | 98.6 /100 | #75 | Exceptional 68.5% |
| Laotians | 98.6 /100 | #76 | Exceptional 68.5% |
| British | 98.6 /100 | #77 | Exceptional 68.5% |
| Danes | 98.6 /100 | #78 | Exceptional 68.5% |
Demographics Similar to Yakama by College, Under 1 year
In terms of college, under 1 year, the demographic groups most similar to Yakama are Tohono O'odham (52.8%, a difference of 0.30%), Immigrants from Mexico (53.7%, a difference of 1.9%), Immigrants from Cabo Verde (53.7%, a difference of 2.0%), Pima (51.4%, a difference of 2.4%), and Spanish American Indian (54.0%, a difference of 2.5%).
| Demographics | Rating | Rank | College, Under 1 year |
| Yuman | 0.0 /100 | #333 | Tragic 55.1% |
| Immigrants | Azores | 0.0 /100 | #334 | Tragic 54.7% |
| Inupiat | 0.0 /100 | #335 | Tragic 54.6% |
| Pennsylvania Germans | 0.0 /100 | #336 | Tragic 54.5% |
| Immigrants | Central America | 0.0 /100 | #337 | Tragic 54.4% |
| Lumbee | 0.0 /100 | #338 | Tragic 54.2% |
| Immigrants | Dominican Republic | 0.0 /100 | #339 | Tragic 54.0% |
| Spanish American Indians | 0.0 /100 | #340 | Tragic 54.0% |
| Immigrants | Cabo Verde | 0.0 /100 | #341 | Tragic 53.7% |
| Immigrants | Mexico | 0.0 /100 | #342 | Tragic 53.7% |
| Tohono O'odham | 0.0 /100 | #343 | Tragic 52.8% |
| Yakama | 0.0 /100 | #344 | Tragic 52.6% |
| Pima | 0.0 /100 | #345 | Tragic 51.4% |
| Houma | 0.0 /100 | #346 | Tragic 47.6% |
| Yup'ik | 0.0 /100 | #347 | Tragic 45.8% |