Immigrants from Europe vs Jamaican Unemployment Among Ages 35 to 44 years
COMPARE
Immigrants from Europe
Jamaican
Unemployment Among Ages 35 to 44 years
Unemployment Among Ages 35 to 44 years Comparison
Immigrants from Europe
Jamaicans
4.6%
UNEMPLOYMENT AMONG AGES 35 TO 44 YEARS
79.4/ 100
METRIC RATING
135th/ 347
METRIC RANK
5.5%
UNEMPLOYMENT AMONG AGES 35 TO 44 YEARS
0.0/ 100
METRIC RATING
290th/ 347
METRIC RANK
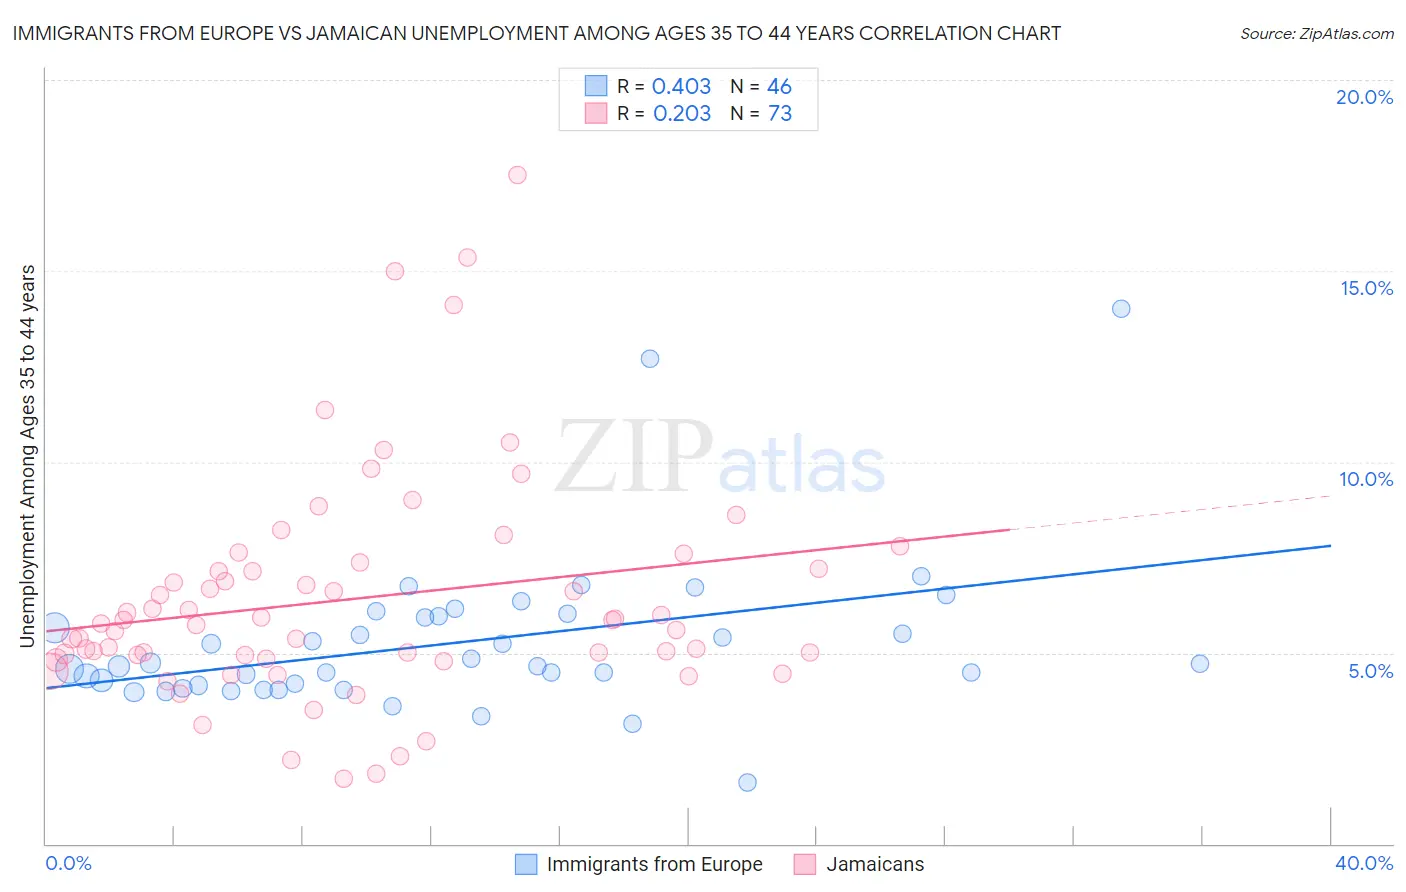
Immigrants from Europe vs Jamaican Unemployment Among Ages 35 to 44 years Correlation Chart
The statistical analysis conducted on geographies consisting of 517,623,945 people shows a moderate positive correlation between the proportion of Immigrants from Europe and unemployment rate among population between the ages 35 and 44 in the United States with a correlation coefficient (R) of 0.403 and weighted average of 4.6%. Similarly, the statistical analysis conducted on geographies consisting of 361,058,465 people shows a weak positive correlation between the proportion of Jamaicans and unemployment rate among population between the ages 35 and 44 in the United States with a correlation coefficient (R) of 0.203 and weighted average of 5.5%, a difference of 20.8%.
Unemployment Among Ages 35 to 44 years Correlation Summary
| Measurement | Immigrants from Europe | Jamaican |
| Minimum | 1.6% | 1.7% |
| Maximum | 14.0% | 17.5% |
| Range | 12.4% | 15.8% |
| Mean | 5.3% | 6.4% |
| Median | 4.7% | 5.8% |
| Interquartile 25% (IQ1) | 4.2% | 4.9% |
| Interquartile 75% (IQ3) | 6.0% | 7.3% |
| Interquartile Range (IQR) | 1.8% | 2.4% |
| Standard Deviation (Sample) | 2.1% | 3.0% |
| Standard Deviation (Population) | 2.0% | 2.9% |
Similar Demographics by Unemployment Among Ages 35 to 44 years
Demographics Similar to Immigrants from Europe by Unemployment Among Ages 35 to 44 years
In terms of unemployment among ages 35 to 44 years, the demographic groups most similar to Immigrants from Europe are Scotch-Irish (4.6%, a difference of 0.010%), Immigrants from Iraq (4.6%, a difference of 0.050%), Laotian (4.6%, a difference of 0.080%), Syrian (4.6%, a difference of 0.14%), and Colombian (4.6%, a difference of 0.16%).
| Demographics | Rating | Rank | Unemployment Among Ages 35 to 44 years |
| Czechoslovakians | 83.4 /100 | #128 | Excellent 4.6% |
| Immigrants | Croatia | 83.1 /100 | #129 | Excellent 4.6% |
| Immigrants | Eritrea | 82.8 /100 | #130 | Excellent 4.6% |
| Immigrants | Colombia | 82.6 /100 | #131 | Excellent 4.6% |
| Colombians | 80.8 /100 | #132 | Excellent 4.6% |
| Syrians | 80.7 /100 | #133 | Excellent 4.6% |
| Laotians | 80.1 /100 | #134 | Excellent 4.6% |
| Immigrants | Europe | 79.4 /100 | #135 | Good 4.6% |
| Scotch-Irish | 79.3 /100 | #136 | Good 4.6% |
| Immigrants | Iraq | 78.9 /100 | #137 | Good 4.6% |
| Immigrants | Norway | 77.5 /100 | #138 | Good 4.6% |
| Immigrants | Hungary | 76.3 /100 | #139 | Good 4.6% |
| Immigrants | Eastern Africa | 76.0 /100 | #140 | Good 4.6% |
| Canadians | 75.9 /100 | #141 | Good 4.6% |
| Ukrainians | 75.8 /100 | #142 | Good 4.6% |
Demographics Similar to Jamaicans by Unemployment Among Ages 35 to 44 years
In terms of unemployment among ages 35 to 44 years, the demographic groups most similar to Jamaicans are Spanish American Indian (5.5%, a difference of 0.080%), Dutch West Indian (5.5%, a difference of 0.11%), Immigrants from Haiti (5.5%, a difference of 0.26%), Cree (5.5%, a difference of 0.42%), and Central American Indian (5.6%, a difference of 0.49%).
| Demographics | Rating | Rank | Unemployment Among Ages 35 to 44 years |
| Immigrants | Ecuador | 0.0 /100 | #283 | Tragic 5.4% |
| Haitians | 0.0 /100 | #284 | Tragic 5.5% |
| Hispanics or Latinos | 0.0 /100 | #285 | Tragic 5.5% |
| Immigrants | Micronesia | 0.0 /100 | #286 | Tragic 5.5% |
| French American Indians | 0.0 /100 | #287 | Tragic 5.5% |
| Cree | 0.0 /100 | #288 | Tragic 5.5% |
| Spanish American Indians | 0.0 /100 | #289 | Tragic 5.5% |
| Jamaicans | 0.0 /100 | #290 | Tragic 5.5% |
| Dutch West Indians | 0.0 /100 | #291 | Tragic 5.5% |
| Immigrants | Haiti | 0.0 /100 | #292 | Tragic 5.5% |
| Central American Indians | 0.0 /100 | #293 | Tragic 5.6% |
| Trinidadians and Tobagonians | 0.0 /100 | #294 | Tragic 5.6% |
| Ottawa | 0.0 /100 | #295 | Tragic 5.6% |
| Immigrants | Trinidad and Tobago | 0.0 /100 | #296 | Tragic 5.6% |
| U.S. Virgin Islanders | 0.0 /100 | #297 | Tragic 5.6% |