Immigrants from Eritrea vs Immigrants from Armenia GED/Equivalency
COMPARE
Immigrants from Eritrea
Immigrants from Armenia
GED/Equivalency
GED/Equivalency Comparison
Immigrants from Eritrea
Immigrants from Armenia
84.3%
GED/EQUIVALENCY
3.5/ 100
METRIC RATING
236th/ 347
METRIC RANK
83.1%
GED/EQUIVALENCY
0.2/ 100
METRIC RATING
262nd/ 347
METRIC RANK
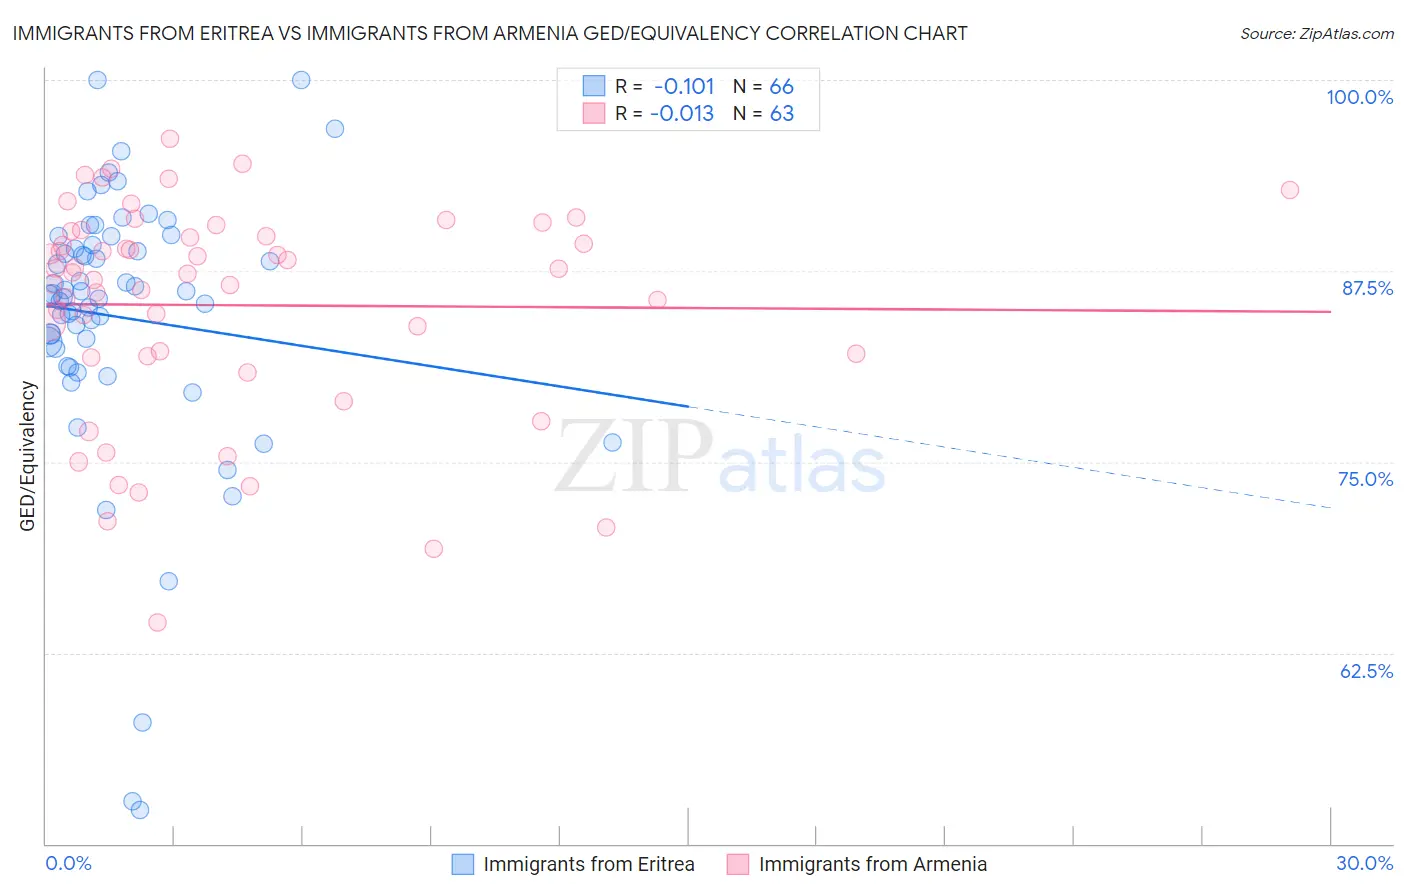
Immigrants from Eritrea vs Immigrants from Armenia GED/Equivalency Correlation Chart
The statistical analysis conducted on geographies consisting of 104,852,788 people shows a poor negative correlation between the proportion of Immigrants from Eritrea and percentage of population with at least ged/equivalency education in the United States with a correlation coefficient (R) of -0.101 and weighted average of 84.3%. Similarly, the statistical analysis conducted on geographies consisting of 97,725,183 people shows no correlation between the proportion of Immigrants from Armenia and percentage of population with at least ged/equivalency education in the United States with a correlation coefficient (R) of -0.013 and weighted average of 83.1%, a difference of 1.5%.
GED/Equivalency Correlation Summary
| Measurement | Immigrants from Eritrea | Immigrants from Armenia |
| Minimum | 52.2% | 64.5% |
| Maximum | 100.0% | 96.1% |
| Range | 47.8% | 31.7% |
| Mean | 84.5% | 85.3% |
| Median | 85.9% | 87.4% |
| Interquartile 25% (IQ1) | 82.4% | 81.9% |
| Interquartile 75% (IQ3) | 89.2% | 90.1% |
| Interquartile Range (IQR) | 6.8% | 8.2% |
| Standard Deviation (Sample) | 9.0% | 7.1% |
| Standard Deviation (Population) | 8.9% | 7.0% |
Similar Demographics by GED/Equivalency
Demographics Similar to Immigrants from Eritrea by GED/Equivalency
In terms of ged/equivalency, the demographic groups most similar to Immigrants from Eritrea are Ghanaian (84.3%, a difference of 0.0%), Immigrants from Nigeria (84.3%, a difference of 0.020%), Subsaharan African (84.2%, a difference of 0.070%), Immigrants from South America (84.4%, a difference of 0.10%), and Immigrants from Panama (84.4%, a difference of 0.10%).
| Demographics | Rating | Rank | GED/Equivalency |
| Immigrants | Uruguay | 4.6 /100 | #229 | Tragic 84.4% |
| Immigrants | Colombia | 4.5 /100 | #230 | Tragic 84.4% |
| Immigrants | Middle Africa | 4.3 /100 | #231 | Tragic 84.4% |
| Immigrants | South America | 4.2 /100 | #232 | Tragic 84.4% |
| Immigrants | Panama | 4.1 /100 | #233 | Tragic 84.4% |
| Immigrants | Nigeria | 3.6 /100 | #234 | Tragic 84.3% |
| Ghanaians | 3.5 /100 | #235 | Tragic 84.3% |
| Immigrants | Eritrea | 3.5 /100 | #236 | Tragic 84.3% |
| Sub-Saharan Africans | 3.0 /100 | #237 | Tragic 84.2% |
| Immigrants | Peru | 2.7 /100 | #238 | Tragic 84.2% |
| Immigrants | Bahamas | 2.6 /100 | #239 | Tragic 84.2% |
| Immigrants | South Eastern Asia | 2.5 /100 | #240 | Tragic 84.1% |
| Senegalese | 1.9 /100 | #241 | Tragic 84.0% |
| Sri Lankans | 1.9 /100 | #242 | Tragic 84.0% |
| Cherokee | 1.3 /100 | #243 | Tragic 83.9% |
Demographics Similar to Immigrants from Armenia by GED/Equivalency
In terms of ged/equivalency, the demographic groups most similar to Immigrants from Armenia are Inupiat (83.1%, a difference of 0.0%), Immigrants from Congo (83.1%, a difference of 0.010%), Bangladeshi (83.1%, a difference of 0.020%), West Indian (83.1%, a difference of 0.030%), and Kiowa (83.1%, a difference of 0.040%).
| Demographics | Rating | Rank | GED/Equivalency |
| Colville | 0.5 /100 | #255 | Tragic 83.4% |
| Africans | 0.5 /100 | #256 | Tragic 83.4% |
| Jamaicans | 0.4 /100 | #257 | Tragic 83.3% |
| Malaysians | 0.4 /100 | #258 | Tragic 83.3% |
| Immigrants | Vietnam | 0.3 /100 | #259 | Tragic 83.2% |
| Choctaw | 0.3 /100 | #260 | Tragic 83.1% |
| Inupiat | 0.2 /100 | #261 | Tragic 83.1% |
| Immigrants | Armenia | 0.2 /100 | #262 | Tragic 83.1% |
| Immigrants | Congo | 0.2 /100 | #263 | Tragic 83.1% |
| Bangladeshis | 0.2 /100 | #264 | Tragic 83.1% |
| West Indians | 0.2 /100 | #265 | Tragic 83.1% |
| Kiowa | 0.2 /100 | #266 | Tragic 83.1% |
| Trinidadians and Tobagonians | 0.2 /100 | #267 | Tragic 83.0% |
| Immigrants | Burma/Myanmar | 0.2 /100 | #268 | Tragic 83.0% |
| Hopi | 0.2 /100 | #269 | Tragic 83.0% |