Immigrants from England vs Immigrants from Argentina Doctorate Degree
COMPARE
Immigrants from England
Immigrants from Argentina
Doctorate Degree
Doctorate Degree Comparison
Immigrants from England
Immigrants from Argentina
2.2%
DOCTORATE DEGREE
99.6/ 100
METRIC RATING
84th/ 347
METRIC RANK
2.2%
DOCTORATE DEGREE
99.7/ 100
METRIC RATING
81st/ 347
METRIC RANK
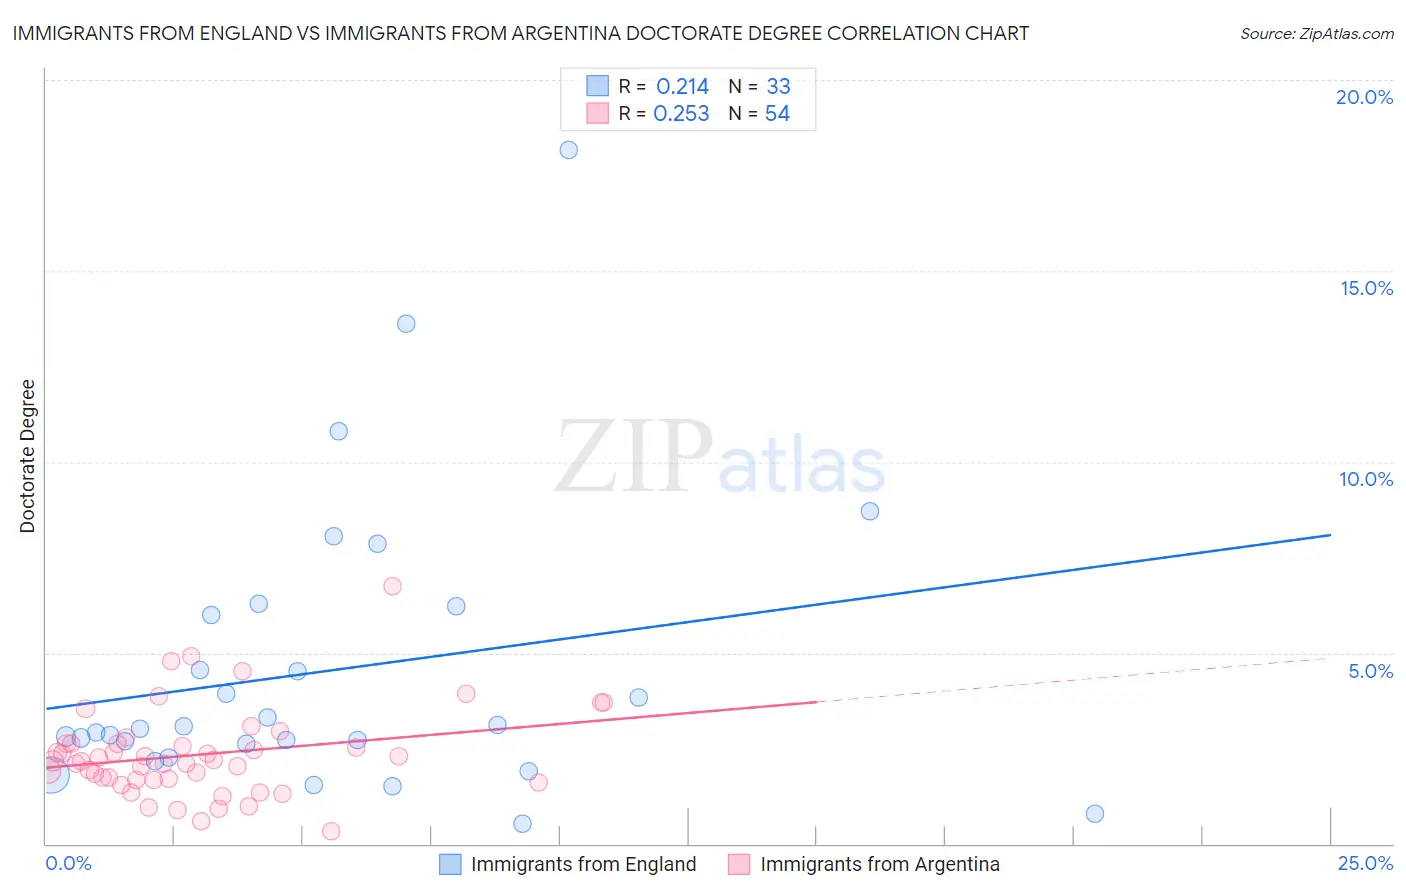
Immigrants from England vs Immigrants from Argentina Doctorate Degree Correlation Chart
The statistical analysis conducted on geographies consisting of 388,548,002 people shows a weak positive correlation between the proportion of Immigrants from England and percentage of population with at least doctorate degree education in the United States with a correlation coefficient (R) of 0.214 and weighted average of 2.2%. Similarly, the statistical analysis conducted on geographies consisting of 263,715,888 people shows a weak positive correlation between the proportion of Immigrants from Argentina and percentage of population with at least doctorate degree education in the United States with a correlation coefficient (R) of 0.253 and weighted average of 2.2%, a difference of 0.86%.
Doctorate Degree Correlation Summary
| Measurement | Immigrants from England | Immigrants from Argentina |
| Minimum | 0.53% | 0.32% |
| Maximum | 18.2% | 6.7% |
| Range | 17.7% | 6.4% |
| Mean | 4.5% | 2.3% |
| Median | 3.0% | 2.2% |
| Interquartile 25% (IQ1) | 2.4% | 1.7% |
| Interquartile 75% (IQ3) | 6.1% | 2.6% |
| Interquartile Range (IQR) | 3.7% | 0.95% |
| Standard Deviation (Sample) | 3.8% | 1.2% |
| Standard Deviation (Population) | 3.8% | 1.2% |
Demographics Similar to Immigrants from England and Immigrants from Argentina by Doctorate Degree
In terms of doctorate degree, the demographic groups most similar to Immigrants from England are Immigrants from Brazil (2.2%, a difference of 0.13%), Immigrants from Lithuania (2.2%, a difference of 0.14%), Immigrants from Uganda (2.2%, a difference of 0.32%), Egyptian (2.2%, a difference of 0.83%), and Ugandan (2.2%, a difference of 0.91%). Similarly, the demographic groups most similar to Immigrants from Argentina are Ugandan (2.2%, a difference of 0.050%), Northern European (2.2%, a difference of 0.34%), Immigrants from Belarus (2.2%, a difference of 0.40%), Immigrants from Uganda (2.2%, a difference of 0.54%), and Immigrants from Lithuania (2.2%, a difference of 0.71%).
| Demographics | Rating | Rank | Doctorate Degree |
| Immigrants | Canada | 99.8 /100 | #72 | Exceptional 2.3% |
| Immigrants | Bulgaria | 99.8 /100 | #73 | Exceptional 2.3% |
| Immigrants | North America | 99.8 /100 | #74 | Exceptional 2.2% |
| Immigrants | Western Asia | 99.8 /100 | #75 | Exceptional 2.2% |
| Immigrants | Hungary | 99.8 /100 | #76 | Exceptional 2.2% |
| Immigrants | Lebanon | 99.8 /100 | #77 | Exceptional 2.2% |
| Immigrants | Belarus | 99.7 /100 | #78 | Exceptional 2.2% |
| Northern Europeans | 99.7 /100 | #79 | Exceptional 2.2% |
| Ugandans | 99.7 /100 | #80 | Exceptional 2.2% |
| Immigrants | Argentina | 99.7 /100 | #81 | Exceptional 2.2% |
| Immigrants | Uganda | 99.6 /100 | #82 | Exceptional 2.2% |
| Immigrants | Lithuania | 99.6 /100 | #83 | Exceptional 2.2% |
| Immigrants | England | 99.6 /100 | #84 | Exceptional 2.2% |
| Immigrants | Brazil | 99.6 /100 | #85 | Exceptional 2.2% |
| Egyptians | 99.4 /100 | #86 | Exceptional 2.2% |
| Immigrants | Zimbabwe | 99.4 /100 | #87 | Exceptional 2.2% |
| Immigrants | Nepal | 99.3 /100 | #88 | Exceptional 2.2% |
| British | 99.3 /100 | #89 | Exceptional 2.2% |
| Immigrants | Scotland | 99.2 /100 | #90 | Exceptional 2.2% |
| Immigrants | Sudan | 99.1 /100 | #91 | Exceptional 2.2% |
| Chileans | 99.1 /100 | #92 | Exceptional 2.2% |