Immigrants from England vs Immigrants from India Single Mother Households
COMPARE
Immigrants from England
Immigrants from India
Single Mother Households
Single Mother Households Comparison
Immigrants from England
Immigrants from India
5.8%
SINGLE MOTHER HOUSEHOLDS
95.5/ 100
METRIC RATING
111th/ 347
METRIC RANK
5.1%
SINGLE MOTHER HOUSEHOLDS
99.9/ 100
METRIC RATING
13th/ 347
METRIC RANK
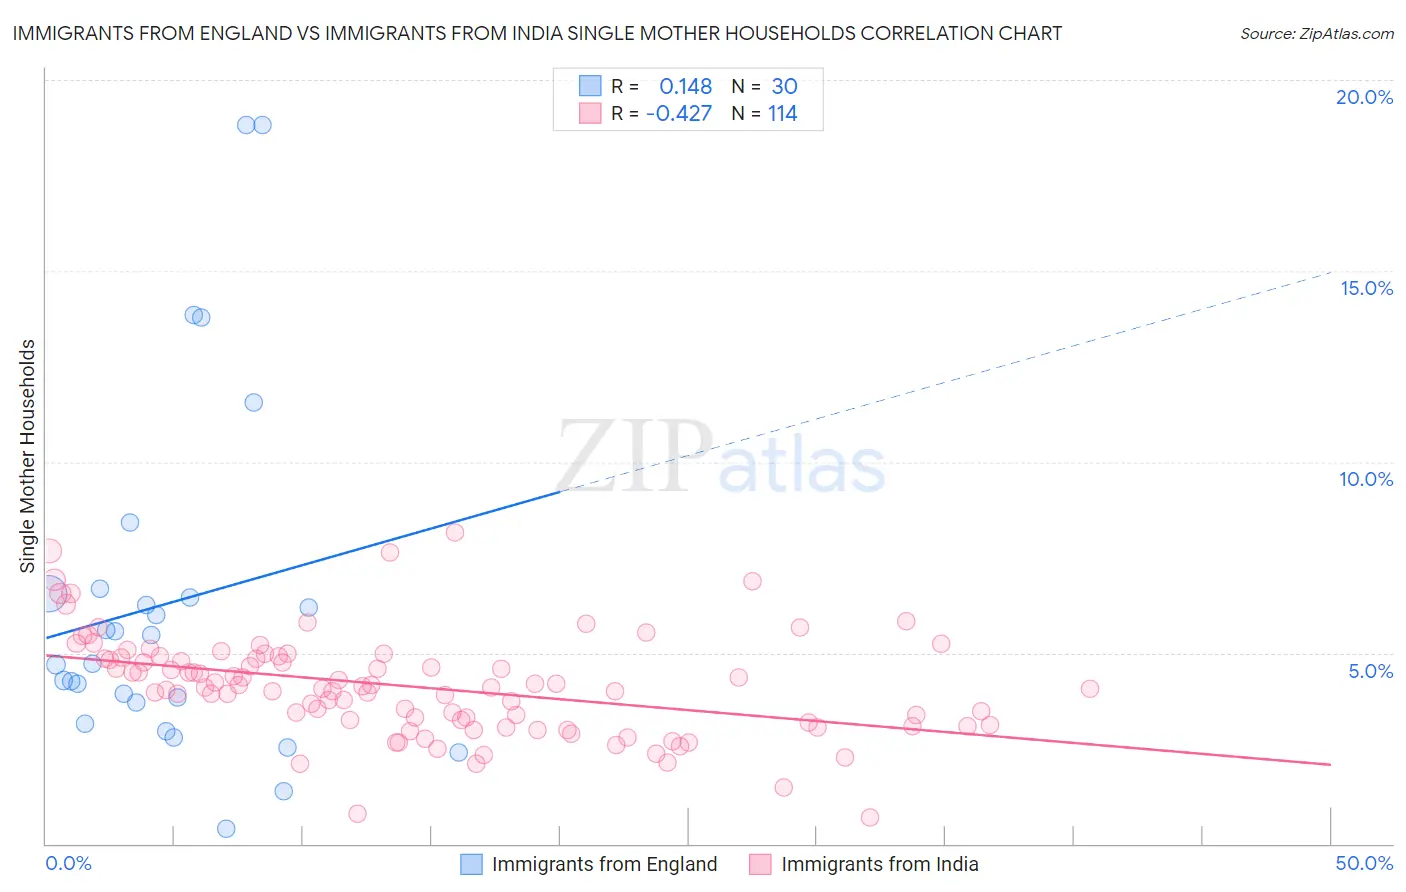
Immigrants from England vs Immigrants from India Single Mother Households Correlation Chart
The statistical analysis conducted on geographies consisting of 390,481,595 people shows a poor positive correlation between the proportion of Immigrants from England and percentage of single mother households in the United States with a correlation coefficient (R) of 0.148 and weighted average of 5.8%. Similarly, the statistical analysis conducted on geographies consisting of 432,741,319 people shows a moderate negative correlation between the proportion of Immigrants from India and percentage of single mother households in the United States with a correlation coefficient (R) of -0.427 and weighted average of 5.1%, a difference of 14.0%.
Single Mother Households Correlation Summary
| Measurement | Immigrants from England | Immigrants from India |
| Minimum | 0.40% | 0.68% |
| Maximum | 18.8% | 8.1% |
| Range | 18.4% | 7.5% |
| Mean | 6.3% | 4.1% |
| Median | 5.1% | 4.1% |
| Interquartile 25% (IQ1) | 3.7% | 3.2% |
| Interquartile 75% (IQ3) | 6.6% | 4.9% |
| Interquartile Range (IQR) | 2.9% | 1.7% |
| Standard Deviation (Sample) | 4.6% | 1.3% |
| Standard Deviation (Population) | 4.5% | 1.3% |
Similar Demographics by Single Mother Households
Demographics Similar to Immigrants from England by Single Mother Households
In terms of single mother households, the demographic groups most similar to Immigrants from England are British (5.8%, a difference of 0.030%), Immigrants from Kuwait (5.8%, a difference of 0.040%), Mongolian (5.8%, a difference of 0.11%), Immigrants from Western Europe (5.8%, a difference of 0.12%), and Immigrants from Italy (5.8%, a difference of 0.21%).
| Demographics | Rating | Rank | Single Mother Households |
| Northern Europeans | 96.2 /100 | #104 | Exceptional 5.8% |
| Taiwanese | 96.1 /100 | #105 | Exceptional 5.8% |
| Immigrants | Ukraine | 95.9 /100 | #106 | Exceptional 5.8% |
| Paraguayans | 95.8 /100 | #107 | Exceptional 5.8% |
| Immigrants | Italy | 95.8 /100 | #108 | Exceptional 5.8% |
| Immigrants | Western Europe | 95.7 /100 | #109 | Exceptional 5.8% |
| British | 95.5 /100 | #110 | Exceptional 5.8% |
| Immigrants | England | 95.5 /100 | #111 | Exceptional 5.8% |
| Immigrants | Kuwait | 95.4 /100 | #112 | Exceptional 5.8% |
| Mongolians | 95.3 /100 | #113 | Exceptional 5.8% |
| Dutch | 95.1 /100 | #114 | Exceptional 5.8% |
| Irish | 94.8 /100 | #115 | Exceptional 5.8% |
| Pennsylvania Germans | 94.7 /100 | #116 | Exceptional 5.8% |
| Bolivians | 94.6 /100 | #117 | Exceptional 5.8% |
| Laotians | 94.3 /100 | #118 | Exceptional 5.8% |
Demographics Similar to Immigrants from India by Single Mother Households
In terms of single mother households, the demographic groups most similar to Immigrants from India are Cypriot (5.1%, a difference of 0.12%), Immigrants from China (5.1%, a difference of 0.30%), Immigrants from Australia (5.1%, a difference of 0.32%), Immigrants from Eastern Asia (5.1%, a difference of 0.42%), and Indian (Asian) (5.1%, a difference of 0.60%).
| Demographics | Rating | Rank | Single Mother Households |
| Immigrants | Singapore | 100.0 /100 | #6 | Exceptional 5.0% |
| Iranians | 100.0 /100 | #7 | Exceptional 5.0% |
| Immigrants | Ireland | 99.9 /100 | #8 | Exceptional 5.0% |
| Okinawans | 99.9 /100 | #9 | Exceptional 5.0% |
| Immigrants | Israel | 99.9 /100 | #10 | Exceptional 5.0% |
| Immigrants | China | 99.9 /100 | #11 | Exceptional 5.1% |
| Cypriots | 99.9 /100 | #12 | Exceptional 5.1% |
| Immigrants | India | 99.9 /100 | #13 | Exceptional 5.1% |
| Immigrants | Australia | 99.9 /100 | #14 | Exceptional 5.1% |
| Immigrants | Eastern Asia | 99.9 /100 | #15 | Exceptional 5.1% |
| Indians (Asian) | 99.9 /100 | #16 | Exceptional 5.1% |
| Soviet Union | 99.9 /100 | #17 | Exceptional 5.1% |
| Immigrants | Armenia | 99.9 /100 | #18 | Exceptional 5.2% |
| Chinese | 99.9 /100 | #19 | Exceptional 5.2% |
| Maltese | 99.9 /100 | #20 | Exceptional 5.2% |