Guyanese vs Creek Bachelor's Degree
COMPARE
Guyanese
Creek
Bachelor's Degree
Bachelor's Degree Comparison
Guyanese
Creek
34.5%
BACHELOR'S DEGREE
2.5/ 100
METRIC RATING
238th/ 347
METRIC RANK
28.9%
BACHELOR'S DEGREE
0.0/ 100
METRIC RATING
319th/ 347
METRIC RANK
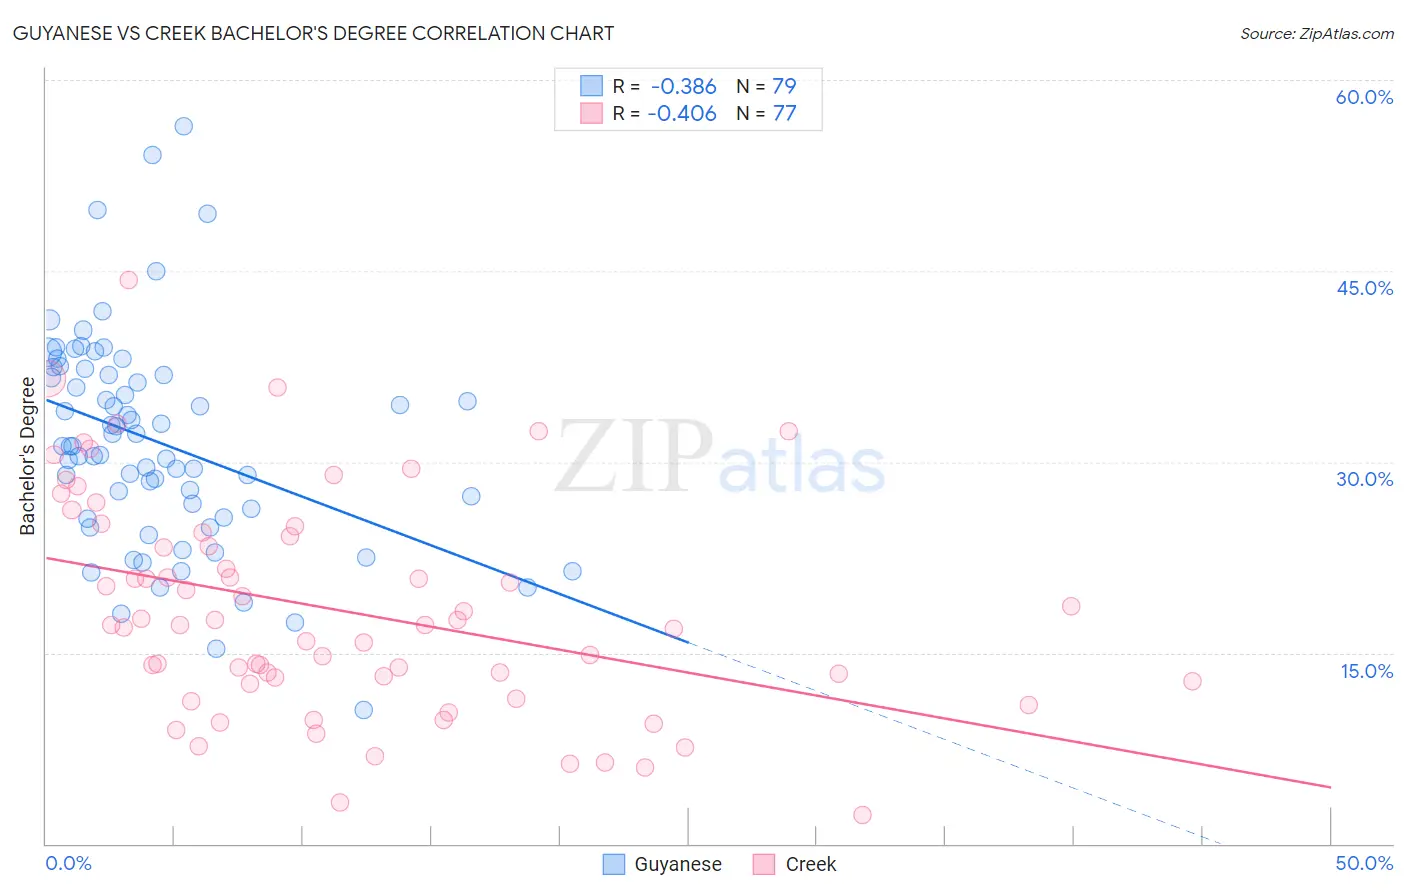
Guyanese vs Creek Bachelor's Degree Correlation Chart
The statistical analysis conducted on geographies consisting of 176,919,737 people shows a mild negative correlation between the proportion of Guyanese and percentage of population with at least bachelor's degree education in the United States with a correlation coefficient (R) of -0.386 and weighted average of 34.5%. Similarly, the statistical analysis conducted on geographies consisting of 178,478,956 people shows a moderate negative correlation between the proportion of Creek and percentage of population with at least bachelor's degree education in the United States with a correlation coefficient (R) of -0.406 and weighted average of 28.9%, a difference of 19.4%.
Bachelor's Degree Correlation Summary
| Measurement | Guyanese | Creek |
| Minimum | 10.5% | 2.3% |
| Maximum | 56.4% | 44.3% |
| Range | 45.9% | 42.0% |
| Mean | 31.5% | 18.4% |
| Median | 31.2% | 17.1% |
| Interquartile 25% (IQ1) | 25.6% | 12.7% |
| Interquartile 75% (IQ3) | 36.9% | 24.3% |
| Interquartile Range (IQR) | 11.3% | 11.6% |
| Standard Deviation (Sample) | 8.4% | 8.6% |
| Standard Deviation (Population) | 8.4% | 8.6% |
Similar Demographics by Bachelor's Degree
Demographics Similar to Guyanese by Bachelor's Degree
In terms of bachelor's degree, the demographic groups most similar to Guyanese are British West Indian (34.5%, a difference of 0.020%), Tlingit-Haida (34.6%, a difference of 0.28%), Liberian (34.6%, a difference of 0.32%), Immigrants from West Indies (34.6%, a difference of 0.43%), and Guamanian/Chamorro (34.6%, a difference of 0.52%).
| Demographics | Rating | Rank | Bachelor's Degree |
| Immigrants | St. Vincent and the Grenadines | 4.3 /100 | #231 | Tragic 35.0% |
| Hmong | 3.4 /100 | #232 | Tragic 34.8% |
| Immigrants | Ecuador | 3.3 /100 | #233 | Tragic 34.7% |
| Guamanians/Chamorros | 3.0 /100 | #234 | Tragic 34.6% |
| Immigrants | West Indies | 2.9 /100 | #235 | Tragic 34.6% |
| Liberians | 2.8 /100 | #236 | Tragic 34.6% |
| Tlingit-Haida | 2.8 /100 | #237 | Tragic 34.6% |
| Guyanese | 2.5 /100 | #238 | Tragic 34.5% |
| British West Indians | 2.5 /100 | #239 | Tragic 34.5% |
| Tongans | 2.0 /100 | #240 | Tragic 34.3% |
| Immigrants | Cambodia | 1.9 /100 | #241 | Tragic 34.2% |
| Immigrants | Nonimmigrants | 1.8 /100 | #242 | Tragic 34.2% |
| Immigrants | Guyana | 1.4 /100 | #243 | Tragic 33.9% |
| Delaware | 1.2 /100 | #244 | Tragic 33.8% |
| Immigrants | Fiji | 1.2 /100 | #245 | Tragic 33.7% |
Demographics Similar to Creek by Bachelor's Degree
In terms of bachelor's degree, the demographic groups most similar to Creek are Kiowa (28.8%, a difference of 0.040%), Alaskan Athabascan (28.8%, a difference of 0.13%), Tsimshian (28.8%, a difference of 0.35%), Yaqui (29.0%, a difference of 0.45%), and Fijian (28.7%, a difference of 0.48%).
| Demographics | Rating | Rank | Bachelor's Degree |
| Seminole | 0.0 /100 | #312 | Tragic 29.4% |
| Alaska Natives | 0.0 /100 | #313 | Tragic 29.4% |
| Shoshone | 0.0 /100 | #314 | Tragic 29.3% |
| Immigrants | Cabo Verde | 0.0 /100 | #315 | Tragic 29.2% |
| Sioux | 0.0 /100 | #316 | Tragic 29.1% |
| Colville | 0.0 /100 | #317 | Tragic 29.0% |
| Yaqui | 0.0 /100 | #318 | Tragic 29.0% |
| Creek | 0.0 /100 | #319 | Tragic 28.9% |
| Kiowa | 0.0 /100 | #320 | Tragic 28.8% |
| Alaskan Athabascans | 0.0 /100 | #321 | Tragic 28.8% |
| Tsimshian | 0.0 /100 | #322 | Tragic 28.8% |
| Fijians | 0.0 /100 | #323 | Tragic 28.7% |
| Dutch West Indians | 0.0 /100 | #324 | Tragic 28.5% |
| Pennsylvania Germans | 0.0 /100 | #325 | Tragic 28.4% |
| Apache | 0.0 /100 | #326 | Tragic 28.3% |